The dollar bobbed above a 13-month low against a basket of major currencies on Wednesday, as investors awaited the U.S. Federal Reserve's policy statement for clues on the course of its next monetary tightening.
Traders also kept an eye on the U.S. Senate, which narrowly agreed to open debate on a bill to end Obamacare.
So far, declining expectations that U.S. President Donald Trump could pull together stimulus have weakened expectations for U.S. growth and inflation.
The Fed is widely expected to keep interest rates unchanged at its two-day meeting that ends on Wednesday. Investors will be watching for any clues on whether it may raise rates again this year, and when it will begin reducing its massive bond portfolio. There is some focus on the possibility that the Fed could indicate September as the starting date for reducing its balance sheet.
For today, the UK is to release preliminary data on second quarter economic growth, the U.S. is to report on new home sales and later in the day, the Fed is to announce its benchmark interest rate and publish a rate statement which outlines economic conditions and the factors affecting the monetary policy decision.
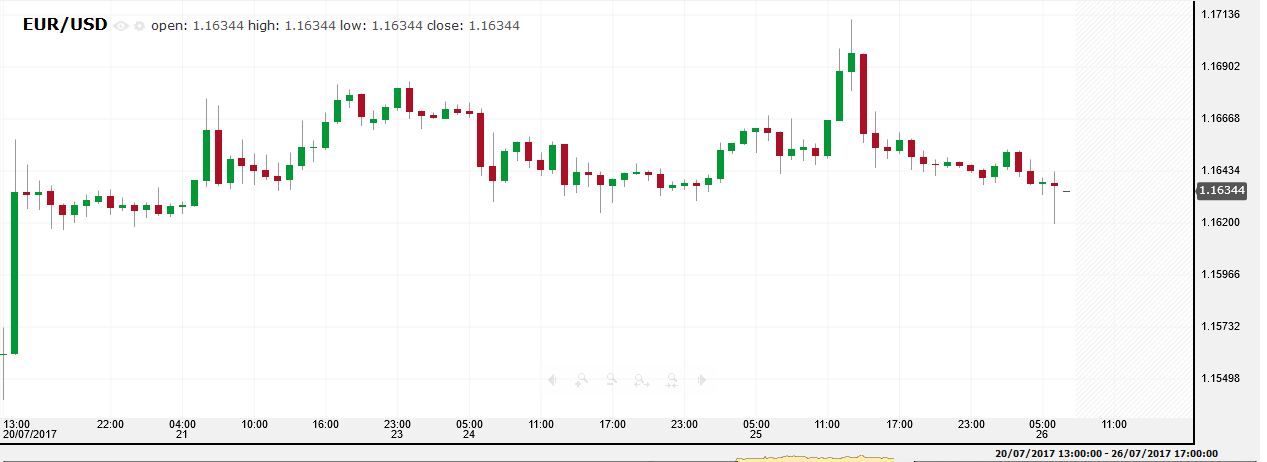
The dollar traded almost flat against the euro on Tuesday, as the Fed’s two-day rate policy meeting overshadowed economic data showing an improvement in consumer optimism about the strength of the U.S. economy.
The Federal Reserve Open Market Committee (FOMC) got its two-day policy meeting underway on Tuesday amid expectations the central bank will leave interest rates unchanged.
Investors, however, will parse the policy statement on Wednesday for fresh insight into the central bank’s thinking on monetary tightening.

Pivot: 1.168
Support: 1.1615 1.1585 1.154
Resistance: 1.168 1.171 1.175
Scenario 1: short positions below 1.1680 with targets at 1.1615 & 1.1585 in extension.
Scenario 2: above 1.1680 look for further upside with 1.1710 & 1.1750 as targets.
Comment: a break below 1.1615 would trigger a drop towards 1.1585.
Gold
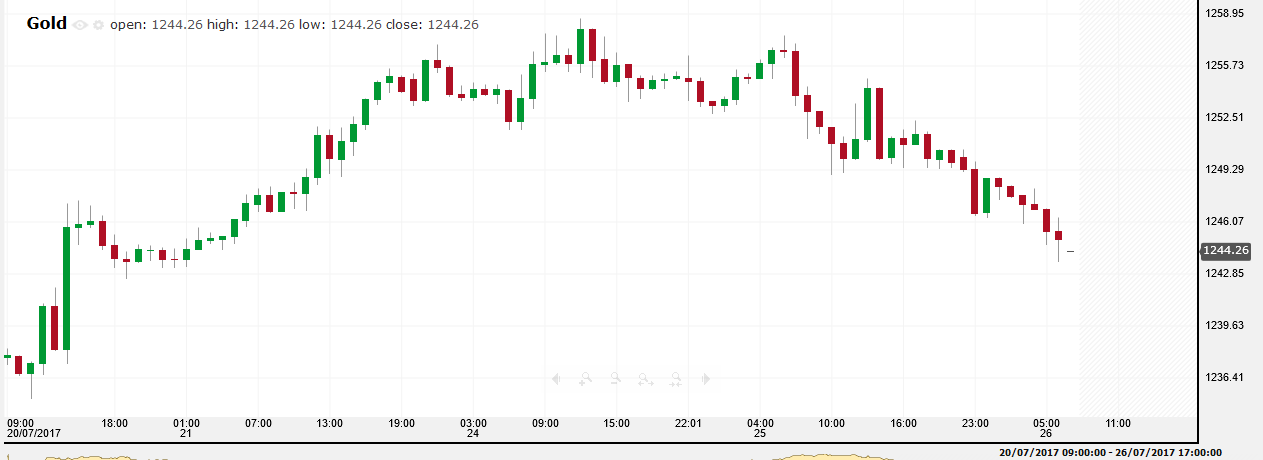
Gold fell on Tuesday, following six consecutive sessions of gains, with sentiment on edge ahead of the latest review of interest rates by the Fed.
Prices slipped from their highest level in around a month on Tuesday, as market players looked ahead to the Federal Reserve's policy meeting for any new insight on the timing of the next U.S. rate hike and clues on how the central bank plans to cut down its balance sheet.
Today, the U.S. will also report on new home sales and later in the day, the Fed is to announce its benchmark interest rate and publish a rate statement.

Pivot: 1252.5
Support: 1242 1239 1235
Resistance: 1252.5 1255.3 1259
Scenario 1: short positions below 1252.50 with targets at 1242.00 & 1239.00 in extension.
Scenario 2: above 1252.50 look for further upside with 1255.30 & 1259.00 as targets.
Comment: the RSI advocates for further downside.
WTI Oil
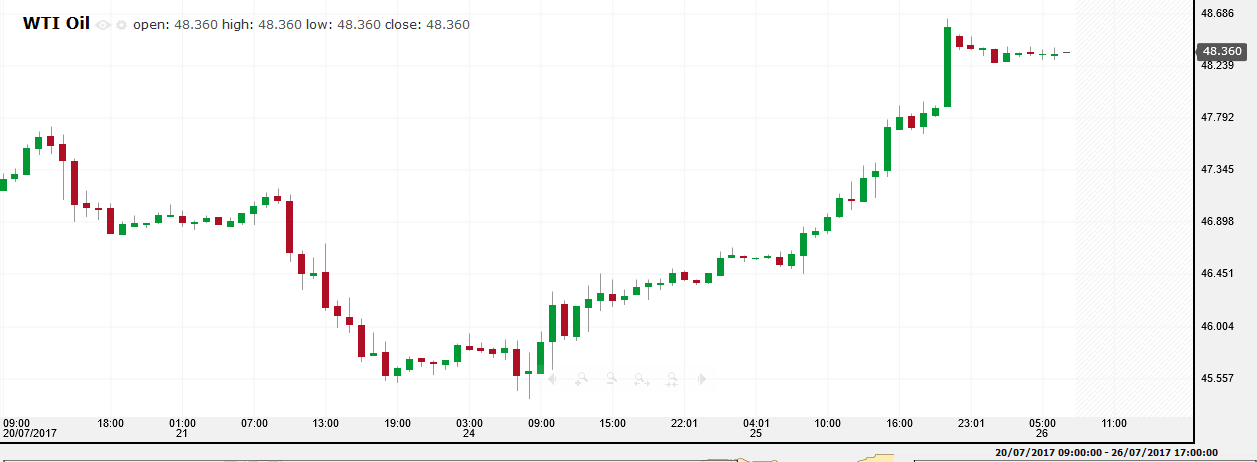
Oil prices gained on Tuesday, as U.S. oil inventories dropped a sharp 10.23 million barrels at the end of last week, the American Petroleum Institute said, with the figure far exceeding an expected 3.0 million barrels decline.
Gasoline supplies rose 1.9 million barrels with expectations of a draw and distillates registered a drop of 0.11 million barrels.
Inventories at the oil storage hub of Cushing, Oklahoma, registered a substantial drop of 2.57 million barrels the 15th weekly draw out of the last 16 weeks. On Wednesday, the Energy Information Administration is due to release official data.global oil supply and demand.

Pivot: 47.17
Support: 47.17 46.68 45.9
Resistance: 49.12 49.58 50.17
Scenario 1: long positions above 47.17 with targets at 49.12 & 49.58 in extension.
Scenario 2: below 47.17 look for further downside with 46.68 & 45.90 as targets.
Comment: the RSI is supported by a rising trend line.
US 500
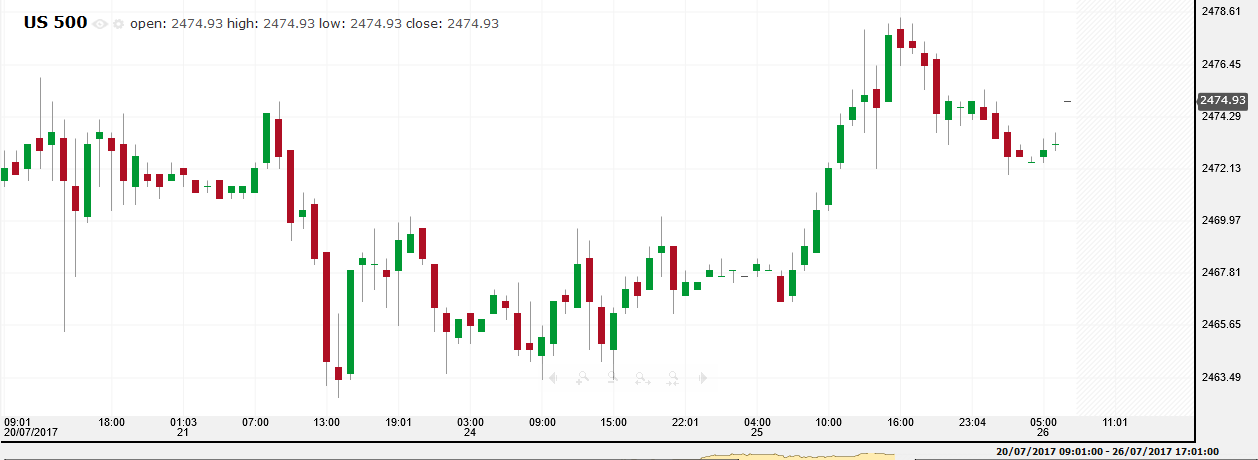
The main US indices were higher on Tuesday as gains in the Basic Materials, Oil & Gas and Financials sectors led shares higher.
At the close in NYSE, the Dow Jones Industrial Average added 0.47% to hit a new all time high, while the S&P 500 index added 0.29%, and the NASDAQ Composite index added 0.02%.
The best performers of the session were Caterpillar (NYSE:CAT) which rose 5.88%, McDonald’s Corporation which added 4.75% and Wal-Mart Stores Inc (NYSE:WMT) that was up 2.12%.
For today, the markets will be focusing on the FOMC rate statement for further clues on the future of the Fed’s monetary policy.

Pivot: 2466.5
Support: 2466.5 2463.75 2461
Resistance: 2480 2485 2490
Scenario 1: long positions above 2466.50 with targets at 2480.00 & 2485.00 in extension.
Scenario 2: below 2466.50 look for further downside with 2463.75 & 2461.00 as targets.
Comment: even though a continuation of the consolidation cannot be ruled out, its extent should be limited.
