The U.S. dollar dropped lower against major currencies on Thursday, as uncertainty surrounding the progress of US. tax reform and public spending continues to mount while weaker-than-expected jobless claims data weighed on the greenback.
The dollar had a weak performance on Thursday, plagued by Wednesday’s Fed minutes, which revealed a reluctance among some Fed members’ to support a raise interest rates, as they await further details on President Trump’s economic plans.
The latest U.S. labour market data, added more pressure to the dollar, after the U.S. Department of Labor said initial jobless claims increased by 6,000 to 244,000 in the week ending February 18 from the previous week’s revised total of 238,000 compared to analysts’ estimates of a rise by 2,000 to 241,000 last week.
For today, Canada is to publish figures on inflation and the U.S. is to round up the week with data on new home sales and a revised report on consumer sentiment.
The euro continues to gain against the dollar on Thursday, as a lack of clarity in the Trump administrations’ policies continues to weigh on the dollar while jobless claims data from the U.S. came out weaker than expected.
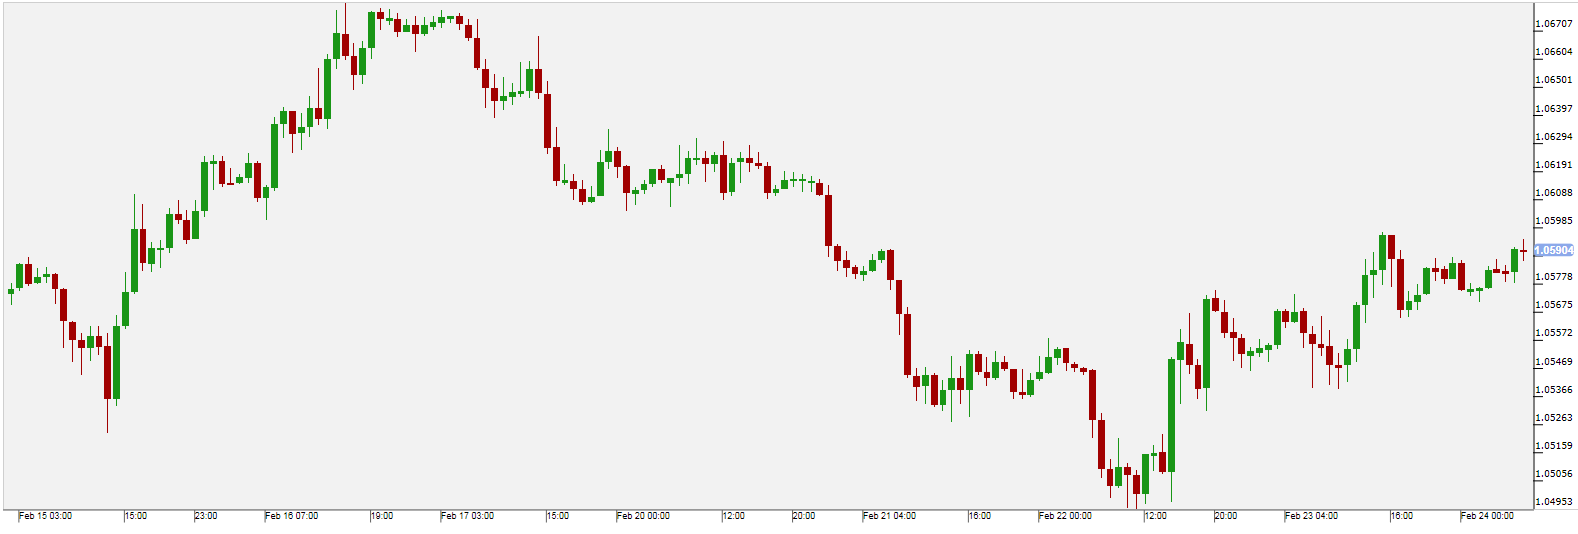
EUR/USD [i] added to the previous session gains to trade at $1.058 up 0.2%, despite a poll showing far-right candidate Le Pen was marginally behind conservative Francois Fillon but 22 points behind centrist Emmanuel Macron in the potential second-round.
Today, the U.S. is to release a revised report on consumer sentiment.
 Pivot: 1.056Support: 1.056 1.054 1.052Resistance: 1.06 1.063 1.0655Scenario 1: long positions above 1.0560 with targets at 1.0600 & 1.0630 in extension.Scenario 2: below 1.0560 look for further downside with 1.0540 & 1.0520 as targets.Comment: the RSI is bullish and calls for further upside.
Gold
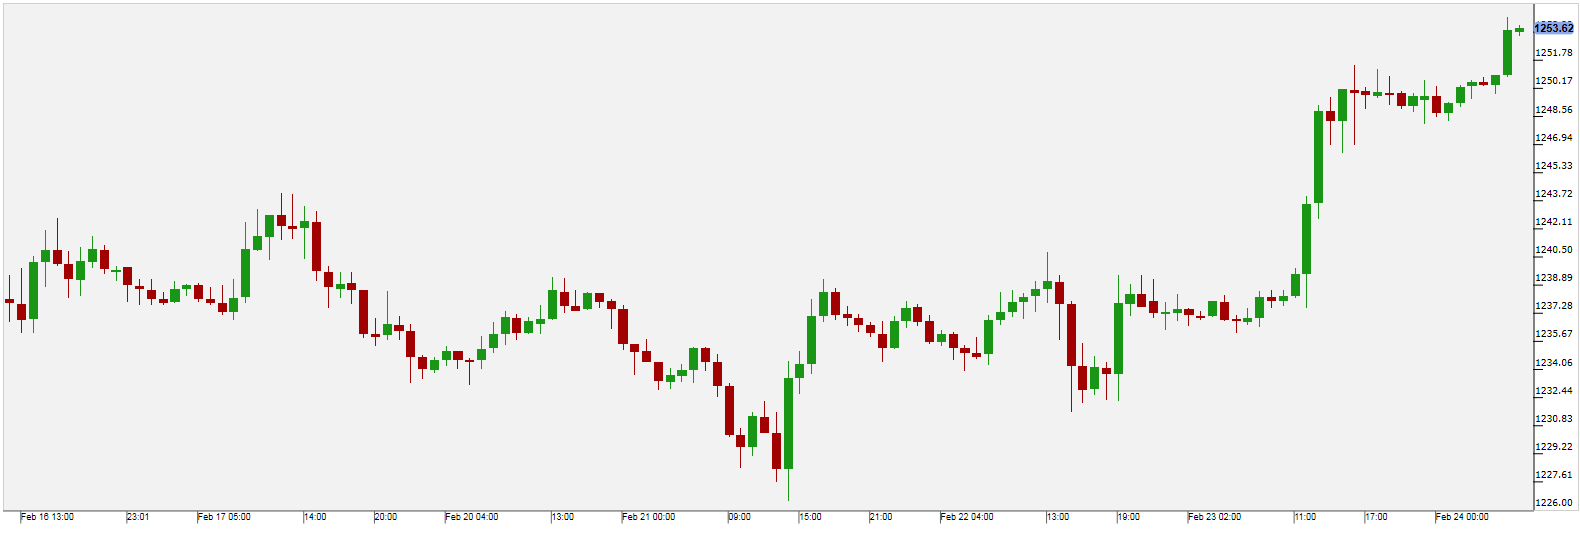
Gold prices gained on Thursday, reaching a 15-week high and crossing the $1250 level, after the minutes of the most recent Federal Reserve policy meeting, was more dovish than expected, weakening hopes of a March interest rate hike.
On Wednesday, some Fed members’ appeared to be reluctant to support a raise interest rates, as they await further details on President Trump’s economic plans in order to assess how Trump’s policies would impact economic growth.
Today, gold traders will be focusing on a report from the U.S. on consumer sentiment.
 Pivot: 1246Support: 1246 1243 1239Resistance: 1257 1259.5 1263Scenario 1: long positions above 1246.00 with targets at 1257.00 & 1259.50 in extension.Scenario 2: below 1246.00 look for further downside with 1243.00 & 1239.00 as targets.Comment: the RSI advocates for further advance.
WTI Oil
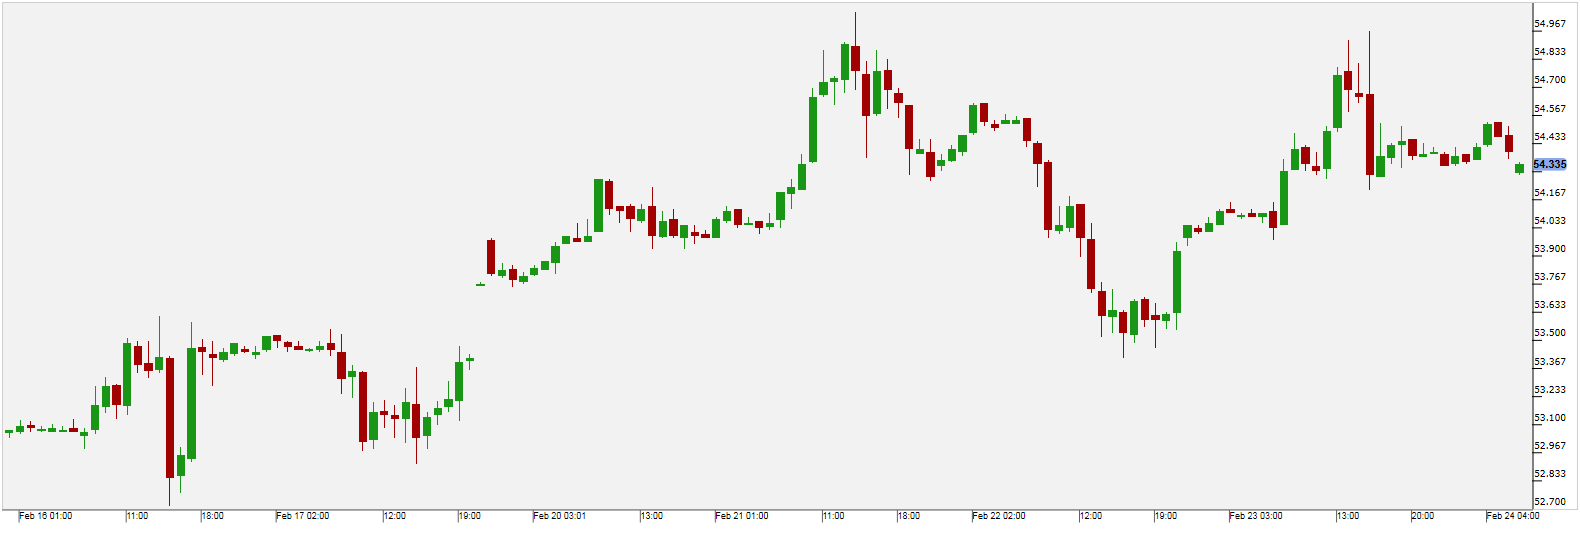
Crude futures [i] settled higher on Thursday, after the latest Energy Information Administration (EIA) report showed a surprise fall in U.S. inventories.
For the week ending February 17, The U.S. Energy Information Administration (EIA) said that crude oil inventories rose by 564,000 barrels, compared to estimates of an increase of 3.745 million barrels. Gasoline inventories decreased by 2.628 million against expectations for a draw of only 0.888 million barrels while distillate stockpiles fell by 4.924 million barrels, compared to expectations of a 0.483 million decline.
On Friday, weekly figures from oilfield services provider Baker Hughes are due on U.S. rig activity. Last week, Baker Hughes said the number of active U.S. rigs drilling for oil rose by six, posting the fifth weekly increase in a row. That brought the total count to 597, the most since November 2015.
 Pivot: 54.6Support: 54.2 54 53.75Resistance: 54.6 54.85 55.03Scenario 1: short positions below 54.60 with targets at 54.20 & 54.00 in extension.Scenario 2: above 54.60 look for further upside with 54.85 & 55.03 as targets.Comment: the upward potential is likely to be limited by the resistance at 54.60.
US 30
U.S. stocks were mixed on Thursday, supported by energy stocks and a renewed pledge by President Donald Trump to chief executives of major U.S. companies to bring back millions of jobs to the United States, however, weak performance on behalf of industrial shares limited the rise.
Comments from new U.S. Treasury Secretary Steven Mnuchin on tax reform failed to inspire a broad rally in equities while weaker than expected U.S. initial jobless claims data capped upside momentum.
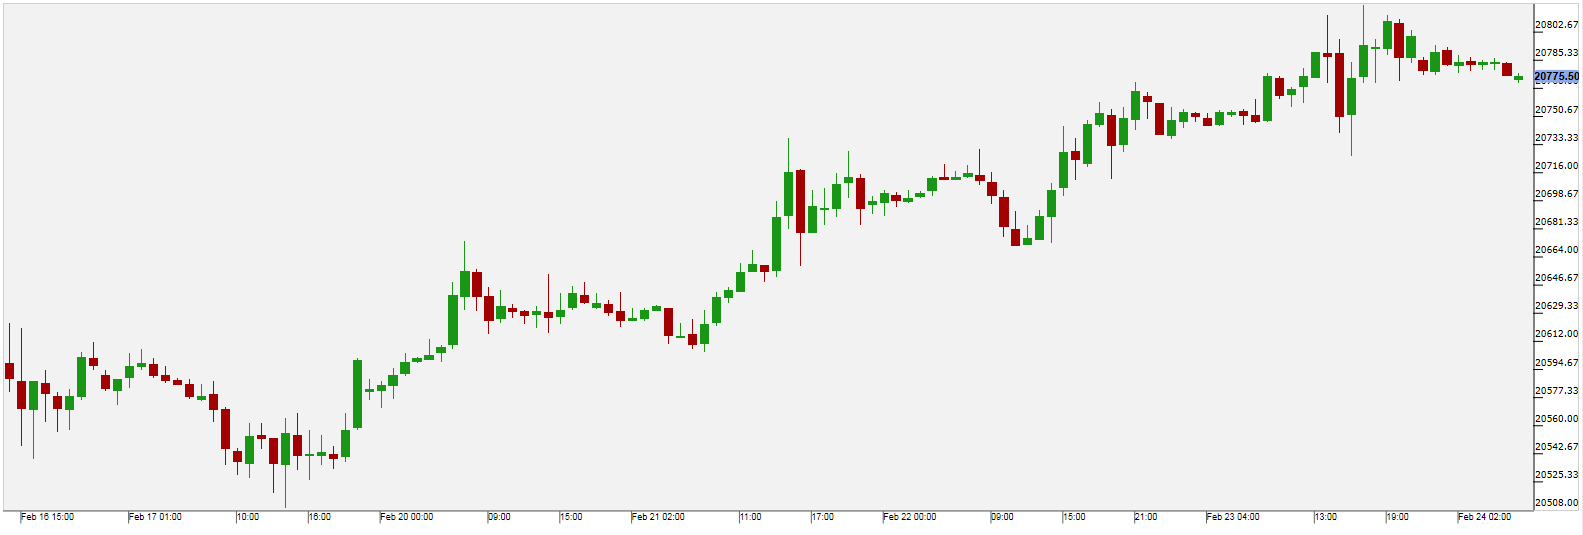
The Dow Jones Industrial Average rose 0.16 percent, the S&P 500 gained 0.04 percent and the Nasdaq rose 0.43 percent.
For today, market participants will be focusing on a report from the U.S. on consumer sentiment.
 Pivot: 20725 Support: 20725 20665 20600 Resistance: 20810 20860 20900 Scenario 1: long positions above 20725.00 with targets at 20810.00 & 20860.00 in extension. Scenario 2: below 20725.00 look for further downside with 20665.00 & 20600.00 as targets. Comment: the RSI lacks downward momentum. The 50-period simple moving average remains ascending.
