The US Dollar declined for the third consecutive day against other major currencies, with the US Dollar Index (USDX) closing lower. The Chinese Yuan (offshore – CNH) recovered on Thursday and initially pushed higher in early trading on Friday, while the US started imposing tariffs on $34B worth of Chinese imports and China vowed to retaliate.
Oil was under pressure as US crude oil stockpile unexpectedly showed a build of 1.2 million barrels within a week, according to data from the EIA.
US equity indices closed overall higher on Thursday and continued to move in the same direction in early trading on Friday, despite concerns what an escalating trade war between the US and China would do to global trade.
Bitcoin and other cryptocurrencies faced a setback after the recent gains, with Bitcoin Cash and Ripple losing more than 5 percent of their value within one day.
On Friday in the United Kingdom the Halifax House Price Index will be published. In Canada data on Employment, Unemployment Rate and Merchandise Trade is due to be released. In the US Trade Balance, Unemployment, Average Hourly Earnings and Work Week statistics will be released, together with the influential NFP data.
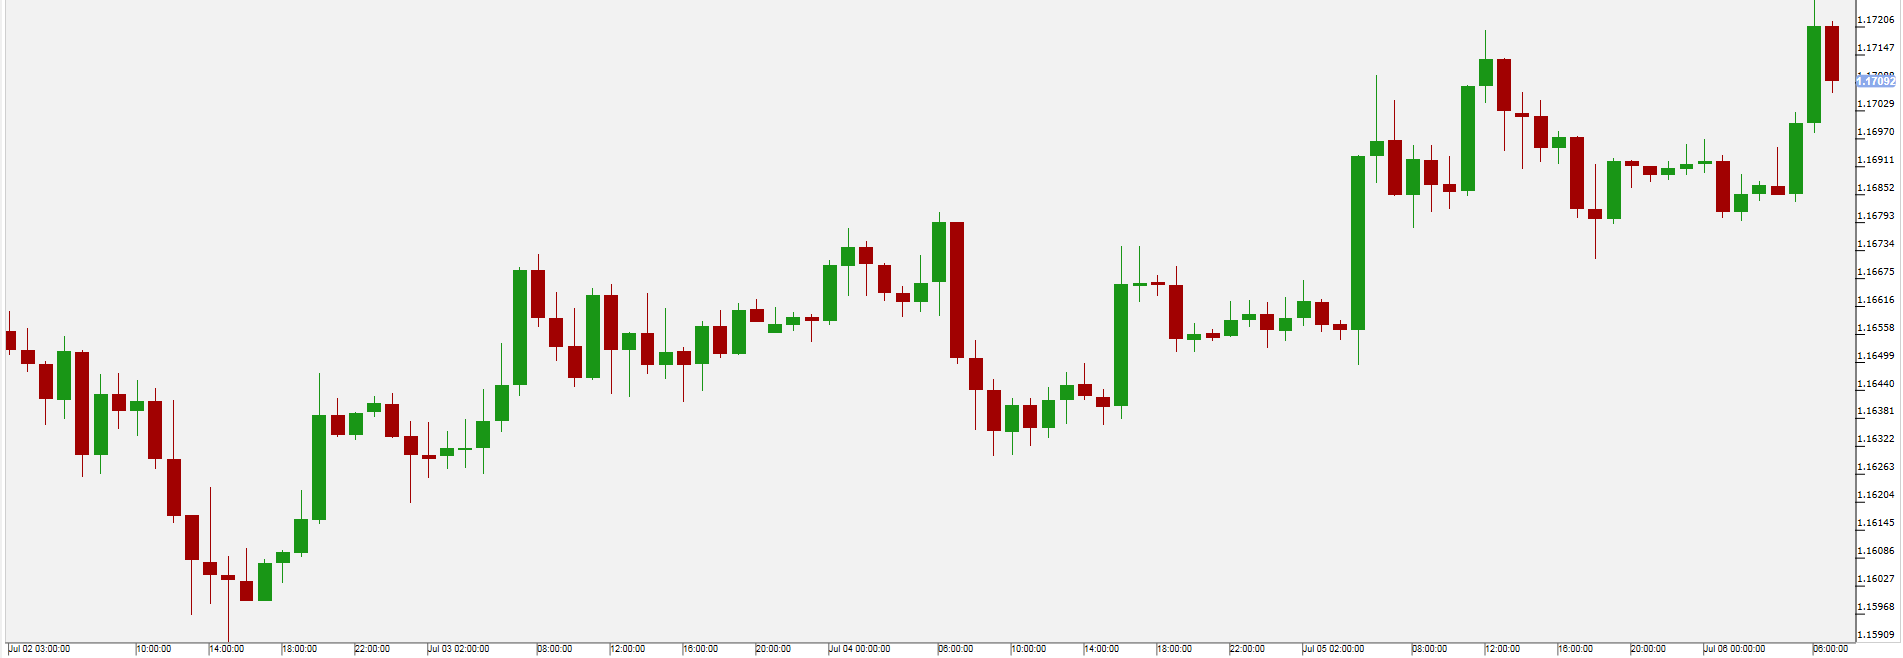
The EUR/USD continued to rise on Thursday and early trading on Friday, while the resistance around 1.172 stopped it from going higher, just as Tuesday last week.
German Manufacturer’s Orders were up by 2.6% m/m (expected +1.1). The US job market data disappointed the set expectations, with the ADP Employment Report at a level of 177,000 thousand (expected 190,000) and Jobless New Claims up at 231,000 (expected 223,000).
On Friday in Germany Industrial Production (IP) and in Italy Retail Sales data is due for release. France publishes its Merchandise Trade statistics.

Pivot:1.168Support:1.1681.1651.163Resistance:1.17451.1761.179Scenario 1:long positions above 1.1680 with targets at 1.1745 & 1.1760 in extension.Scenario 2:below 1.1680 look for further downside with 1.1650 & 1.1630 as targets.Comment:the break above 1.1680 is a positive signal that has opened a path to 1.1745. The pair validated a Symmetrical Triangle: a bullish continuation pattern calling for further advance.
Hong Kong 50
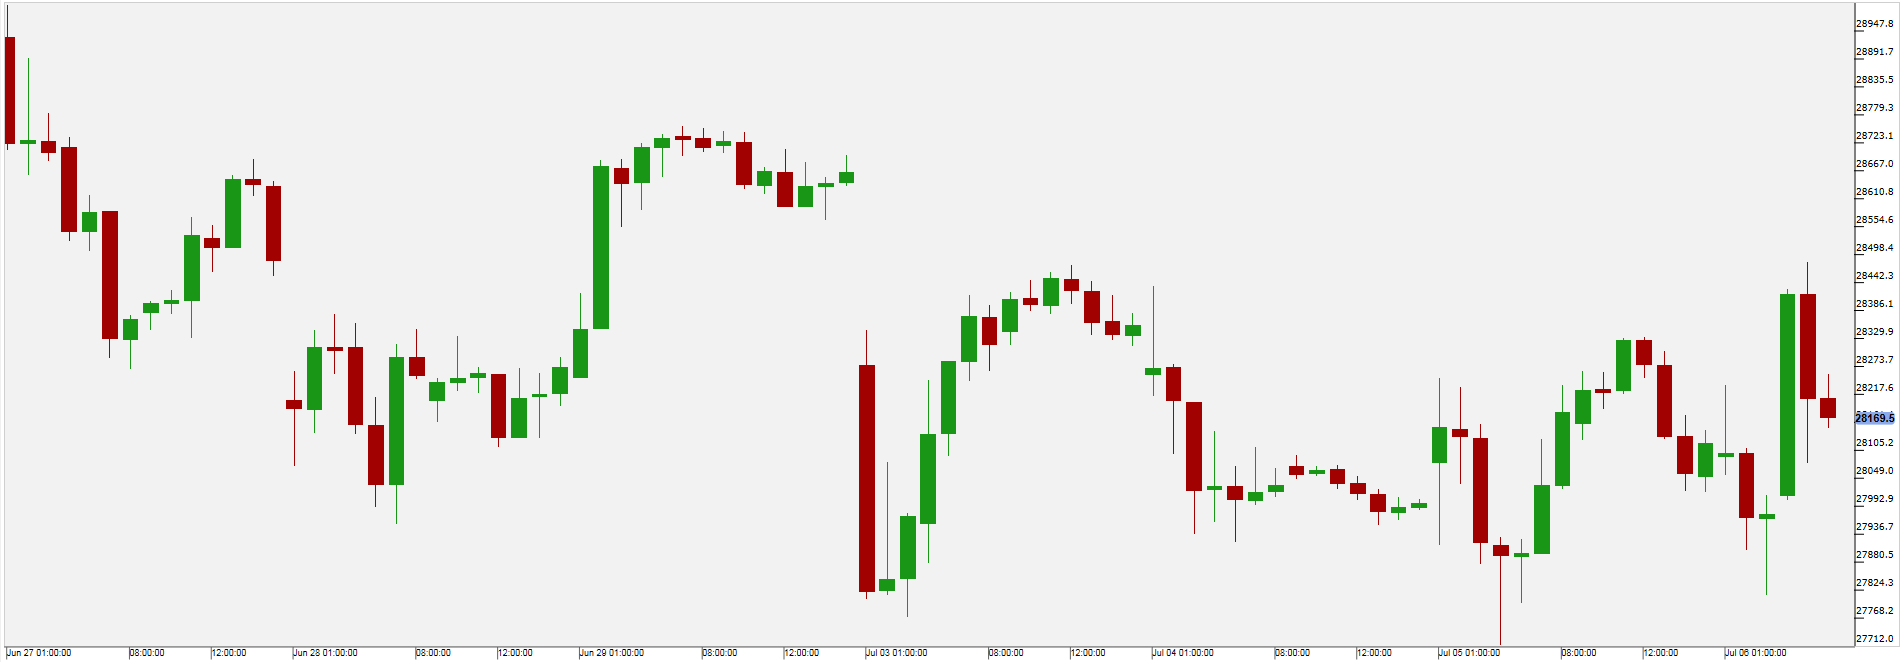
The Hang Seng (Hong Kong 50) Index showed a limited upside in a relatively calm trading session, considering that US tariffs on Chinese import came into force on Friday.
Investment banks such as Morgan Stanley and Goldman Sachs meanwhile lowered their target for Chinese stock indices and the market in Hong Kong over slowing growth worldwide, the increasingly tightening of the monetary policy by the Federal Reserve and the current trade frictions.
It was announced that the state-owned China Railway Corporation will form a joint venture with tech company Tencent and the holding group of car maker Geely Auto to provide WiFi services in China’s expanding high speed train system.
Next week in China data on inflation, loans and trade balance is due to be released.

Pivot:28490Support:279402772027500Resistance:284902886029070Scenario 1:short positions below 28490.00 with targets at 27940.00 & 27720.00 in extension.Scenario 2:above 28490.00 look for further upside with 28860.00 & 29070.00 as targets.Comment:the RSI is mixed with a bearish bias. The index is ranging within the bearish channel.
WTI Oil
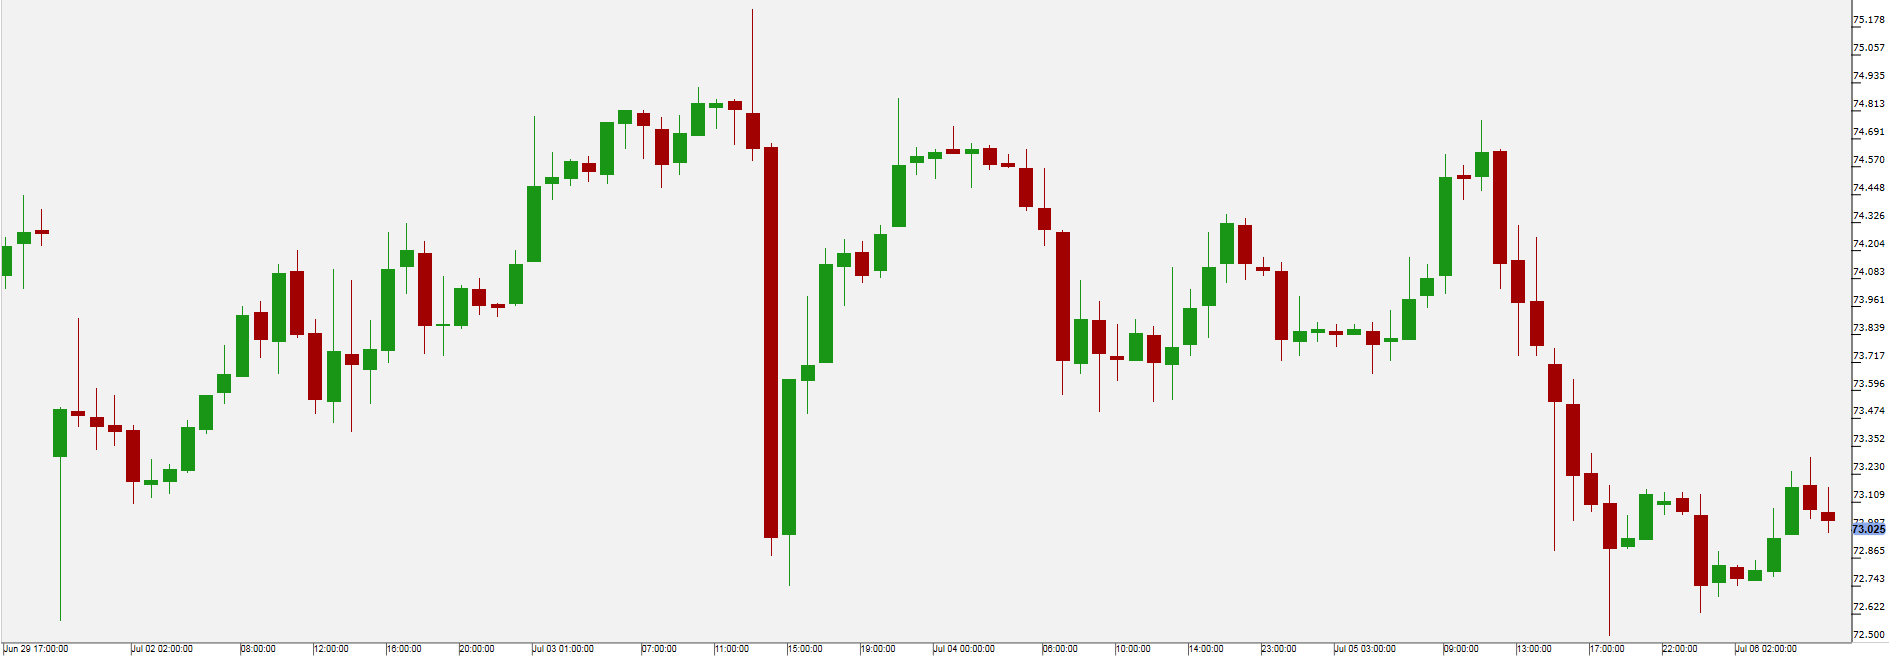
Oil was again under pressure, with WTI oil further falling below the recent high. According to data from the Energy Information Administration (EIA), crude oil inventories unexpectedly showed a build of 1.2 million barrels after 3 consecutive weeks of reducing stockpiles. Gasoline inventories declined by 1.5 million barrels and distillate inventories were reported to be very moderately higher.
This build in crude oil stockpiles was in part possible due to rising oil imports and some refineries cutting their output.
China mentioned that it could retaliate against US tariffs by putting tariffs on crude oil imports from the US. Some analysts pointed out that this move could benefit Iran and counter the US efforts to persuade other countries to shun Iranian oil.
On Friday the Baker Hughes Oil Rig Count will be released, which indicates the number of operating oil rigs in the United States.

Pivot:73.45Support:72.6272.1571.4Resistance:73.4574.374.8Scenario 1:short positions below 73.45 with targets at 72.62 & 72.15 in extension.Scenario 2:above 73.45 look for further upside with 74.30 & 74.80 as targets.Comment:the RSI is mixed to bearish. The prices are trading below both 20-period and 50-period moving averages.
US 500
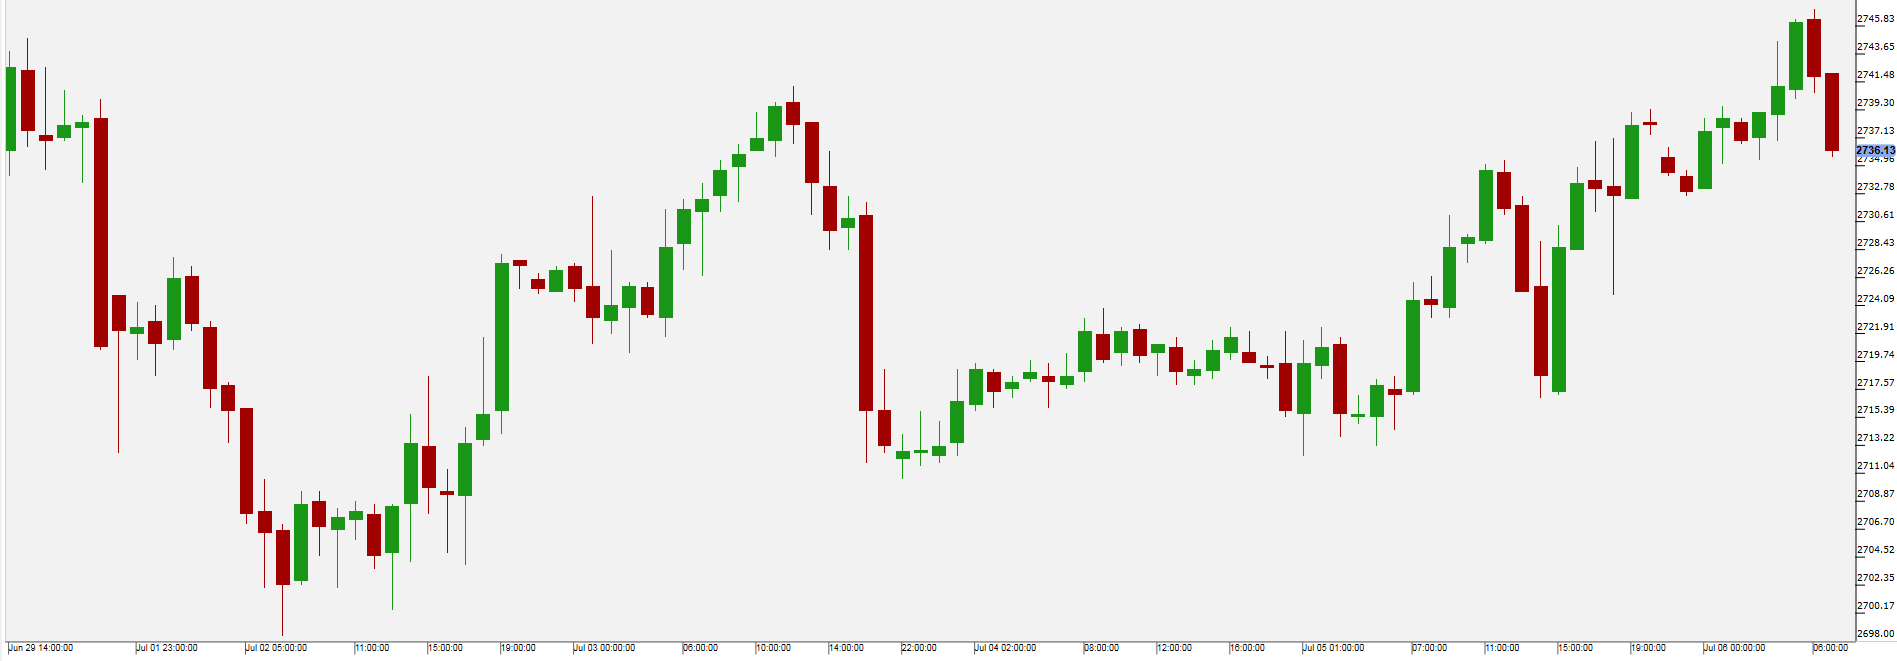
US equity indices traded higher on Thursday, while investors remain on edge about the possible fallout from the US starting with a new tariff regime on $34B worth of Chinese imports.
Especially chip maker stocks (US Semiconductors ETF +2.48%) and other technology stocks (US Technology ETF +1.48%) closed higher, while overall stock prices of energy companies (US Energy ETF (NYSE:XLE) -0.17%) faced moderate drops.
Facebook (NASDAQ:FB) (+3.06%) was possibly supported by a positive analyst review of the company, especially due to the high number of daily
active users of the Facebook owned Instagram platform, with Instagram Stories having twice as many daily active users compared to Snapchat (+0.08%).
On Friday in the US the Non-Farm Payrolls (NFP), Unemployment Rate, Average Hourly earnings, Average Work Week and Trade Balance level data will be released.

Pivot: 2728 Support: 2728 2723 2717 Resistance: 2749.25 2757.5 2769 Scenario 1: long positions above 2728.00 with targets at 2749.25 & 2757.50 in extension. Scenario 2: below 2728.00 look for further downside with 2723.00 & 2717.00 as targets. Comment: the RSI shows upside momentum. The index broke above the upper resistance line of symmetric triangle.
