The US Dollar closed lower against other major currencies on Friday with the US Dollar Index (USDX) falling by 0.75%. With the weak US Dollar, the Chinese Yuan (CNH – Offshore) closed stronger for the first time in more than two weeks. However in early trading on Monday, the Yuan continued to depreciate towards a new 7 months low, with Chinese stocks also trading lower at the start of the week.
Oil traded higher on Friday, with WTI oil reaching a new high in over 3 years. Then on Monday oil gave away some of its profits as Saudi Arabian supplies increased and markets were concerned about a possible economic slowdown in Asia.
US equity indices closed almost unchanged on Friday, however on a weekly basis indices closed lower, with the Dow Jones Industrial Average (US 30) closing lower for the third week in a row.
Cryptocurrencies pushed higher from the year-to-date lows seen last week. Bitcoin traded again as high as $6,500 on Saturday. Other major cryptocurrencies also recovered in a similar way with Ethereum gaining almost 10% overnight from Friday to Saturday.
On Monday Switzerland publishes its Adjusted Real Retail Sales and SVME PMI level data. The EU will release PMI Manufacturing and Unemployment data. In the US the ISM Manufacturing Index and Construction Spending data is due for release.
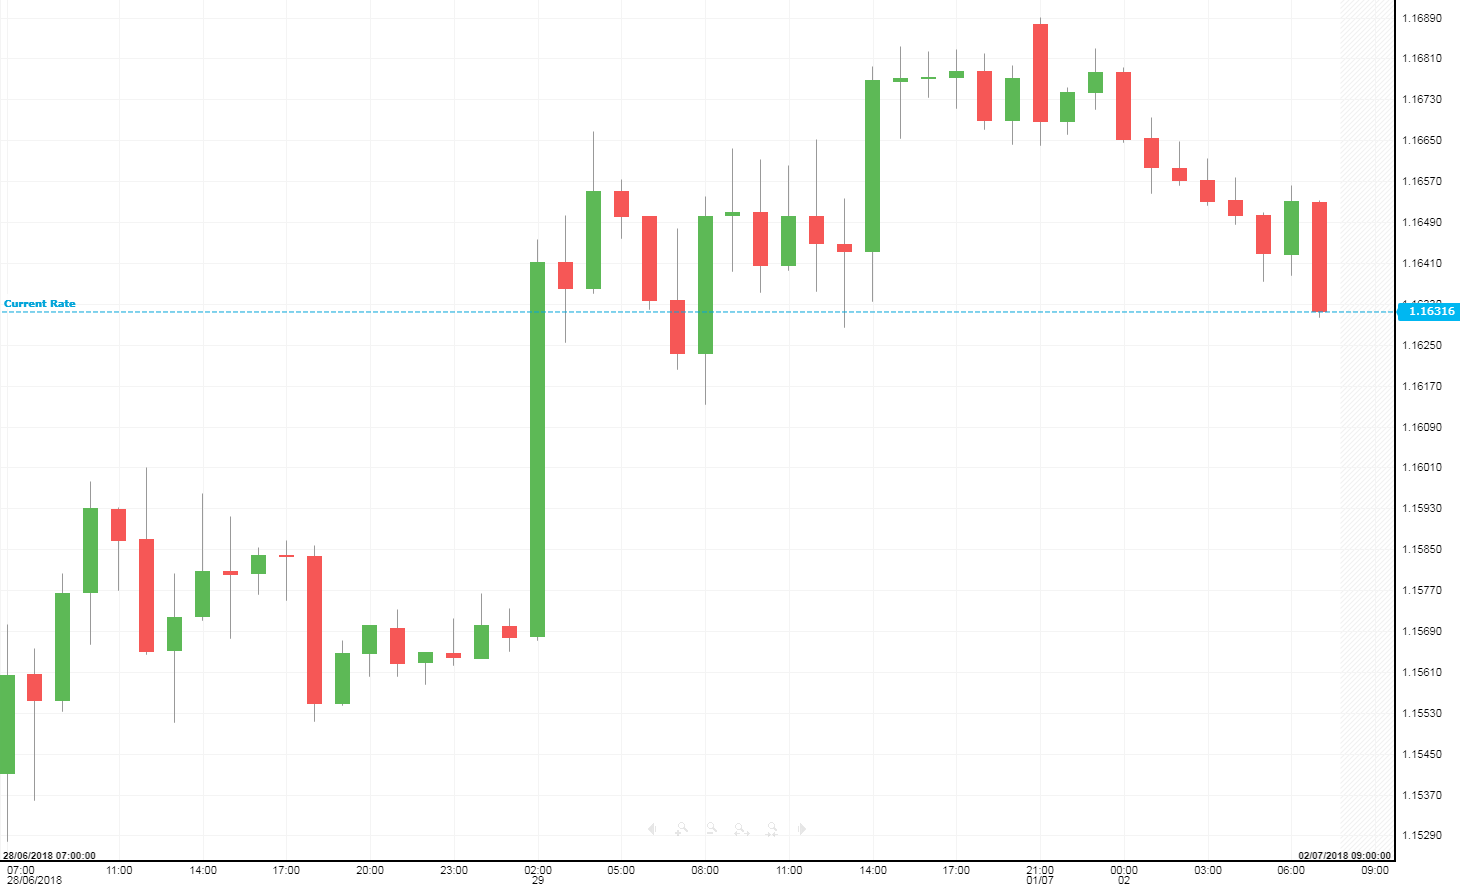
With the Dollar trading weaker against most other currencies on Friday, the EUR/USD managed to close for the second consecutive week higher - the first time in five months. While German Retail Sales at -2.1% m/m (expected -0.4%) were disappointing, the Unemployment Rate remained stable at 5.2% as expected. The European Harmonised Index of Consumer Prices (HICP) was also as expected at 2% y/y.
In the US the Personal Income was as expected at +0.4% m/m, while Consumer Spending at +0.2% m/m fell behind expectations (expected +0.4%). The University of Michigan Consumer Sentiment was also below expectations, falling to 98.2 (expected 99.0).
On Monday in Germany and the EU the PMI Manufacturing will be released. Later the EU also releases Unemployment Rate data. In the US the ISM Manufacturing Index will be published.

Pivot: 1.164
Support: 1.164 1.161 1.157
Resistance: 1.1665 1.169 1.172
Scenario 1: long positions above 1.1640 with targets at 1.1665 & 1.1690 in extension.
Scenario 2: below 1.1640 look for further downside with 1.1610 & 1.1570 as targets.
Comment:intraday technical indicators are mixed and call for caution.
Gold
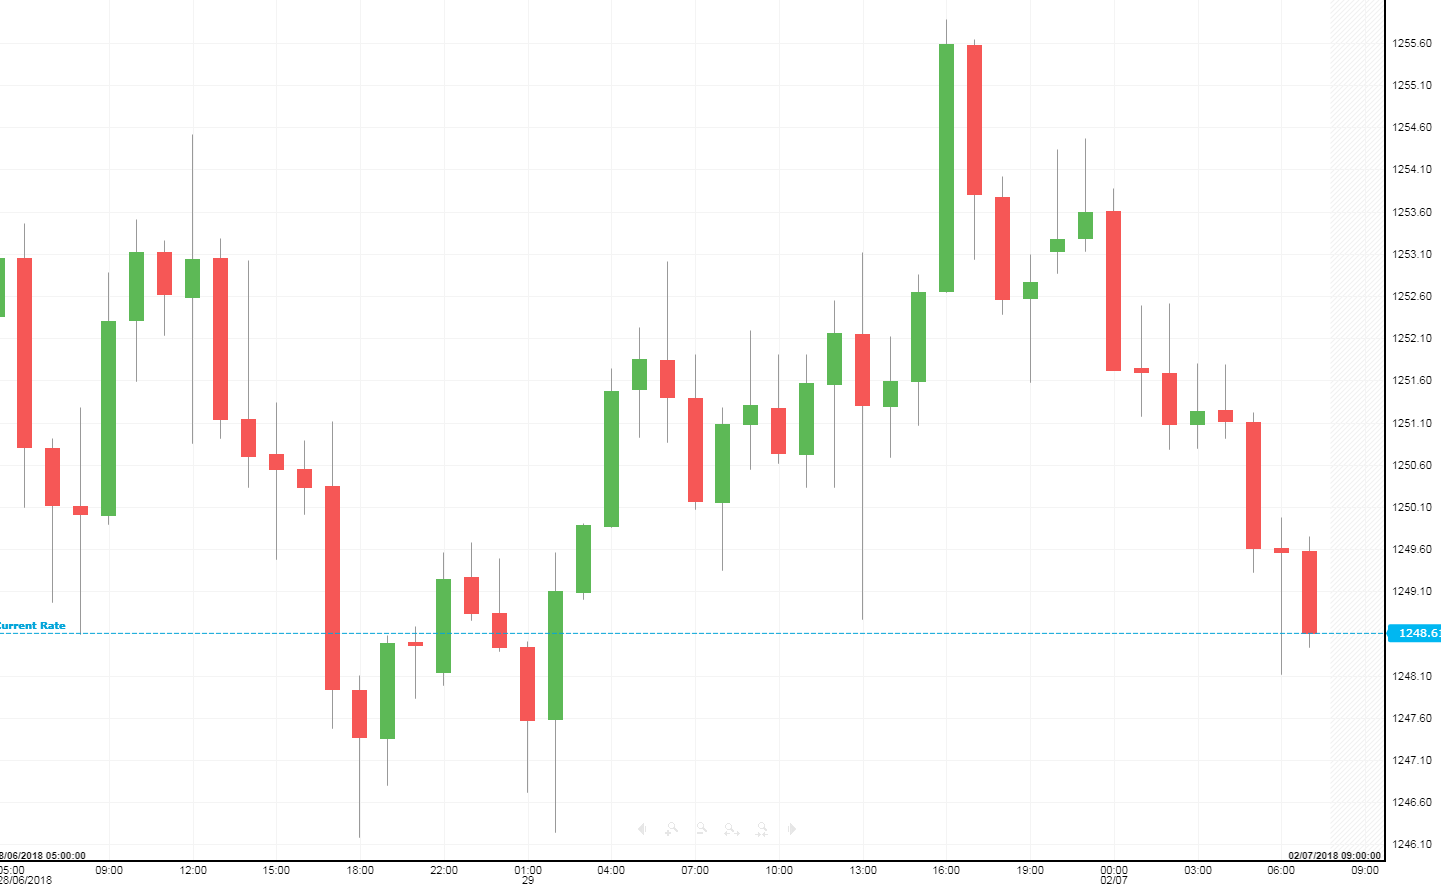
Gold closed higher on Friday, for the first time in that week. However the gains were erased already in early trading on Monday, where gold again pushed lower as also the US Dollar gained strength.
Gold remains under pressure as the Federal Reserve is likely to continue raising its interest rates. Higher interest rates on safe money market instruments and bonds, are believed to negatively affect the price of gold, which does not bear any interest.
The Commitments of Traders (COT) statistic from the Commodity Futures Trading Commission's (CFTC), that were released on Friday, showed now only 76.7 thousand bullish positions on gold (previous 96.5 thousand).
Some key events this week for gold traders will be the publication of the FOMC Meeting Minutes on Thursday and the US Trade Balance statistic and NFP numbers released on Friday.

Pivot: 1251.5
Support: 1245.5 1243 1239
Resistance: 1251.5 1255.5 1259
Scenario 1: short positions below 1251.50 with targets at 1245.50 & 1243.00 in extension.
Scenario 2: above 1251.50 look for further upside with 1255.50 & 1259.00 as targets.
Comment:the RSI advocates for further decline.
WTI Oil
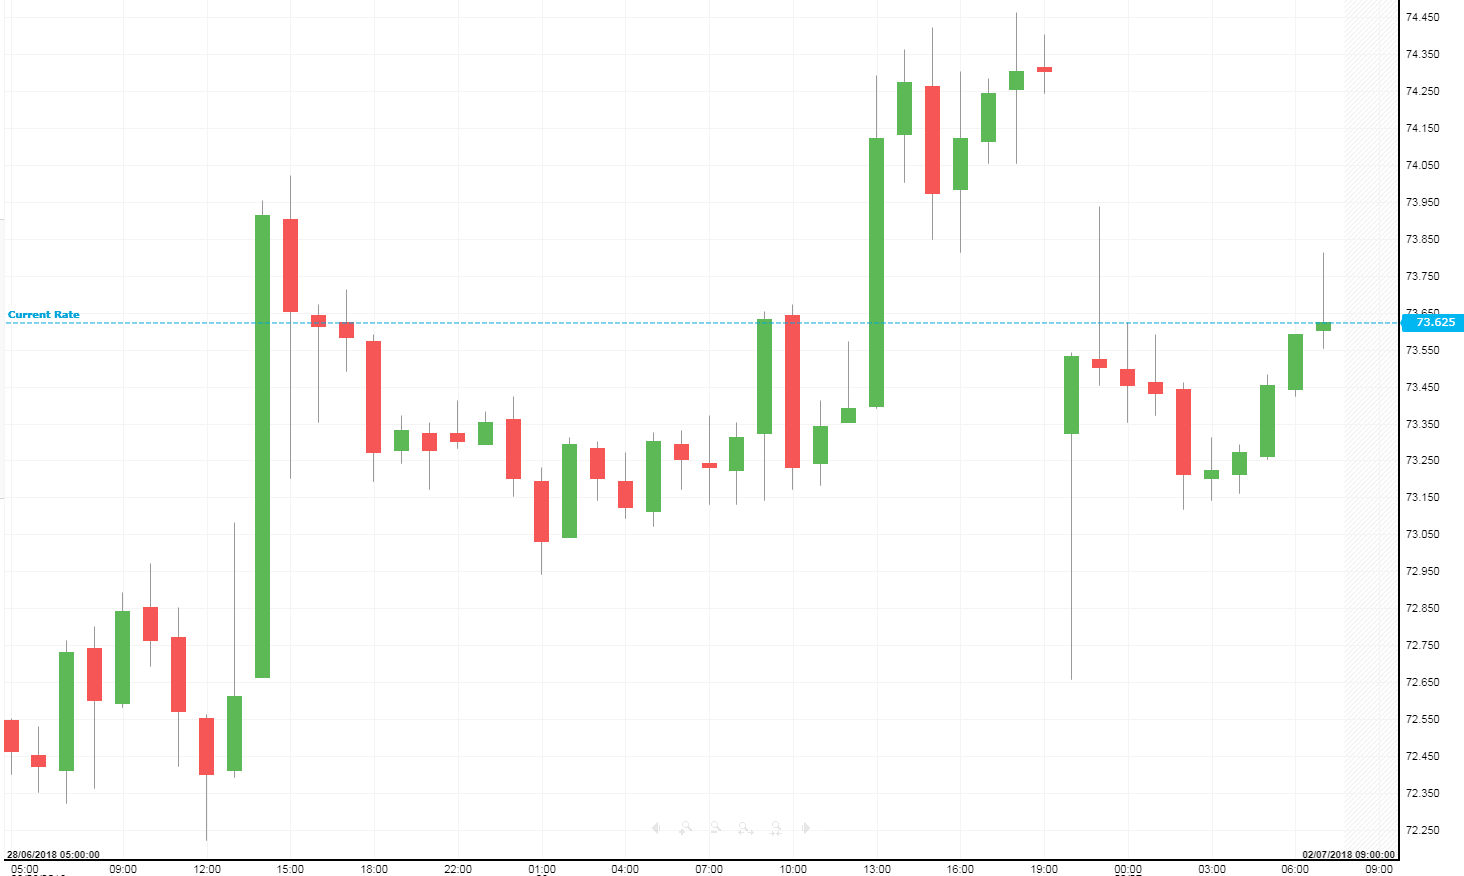
WTI oil reached a new 3-1/2 years high on Friday, before giving away some of its gains in early trading on Monday. The prices were on the rise as there are supply concerns in the energy markets market with uncertainty about the political situation in Libya and Iranian oil exports being shunned by major players in the oil business over US sanctions fears.
The US Baker Hughes Oil Rig Count fell by 4 operating oil rigs to 858, which is the first time this year that the amount of producing oil rigs falls for two weeks in a row. While US oil production is at its high point, pipelines in the Permian Basin and in East New Mexico are operating near maximum capacity, which according to analysts means that some producers will have to shut down their operation due to the lacking capacity.
On Tuesday the American Petroleum Institute (API) will release oil stockpile figures, followed by the Energy Information Administration (EIA) on Thursday this week.

Pivot: 74
Support: 72.2 71.7 71.2
Resistance: 74 74.5 75.2
Scenario 1: short @ 73.24 with targets @ 72.20 & 71.70 in extension.
Scenario 2: above 74.00 look for further upside with 74.50 & 75.20 as targets.
Comment:the RSI advocates for further decline. The prices are trading below both 20-period and 50-period moving averages.
US 500
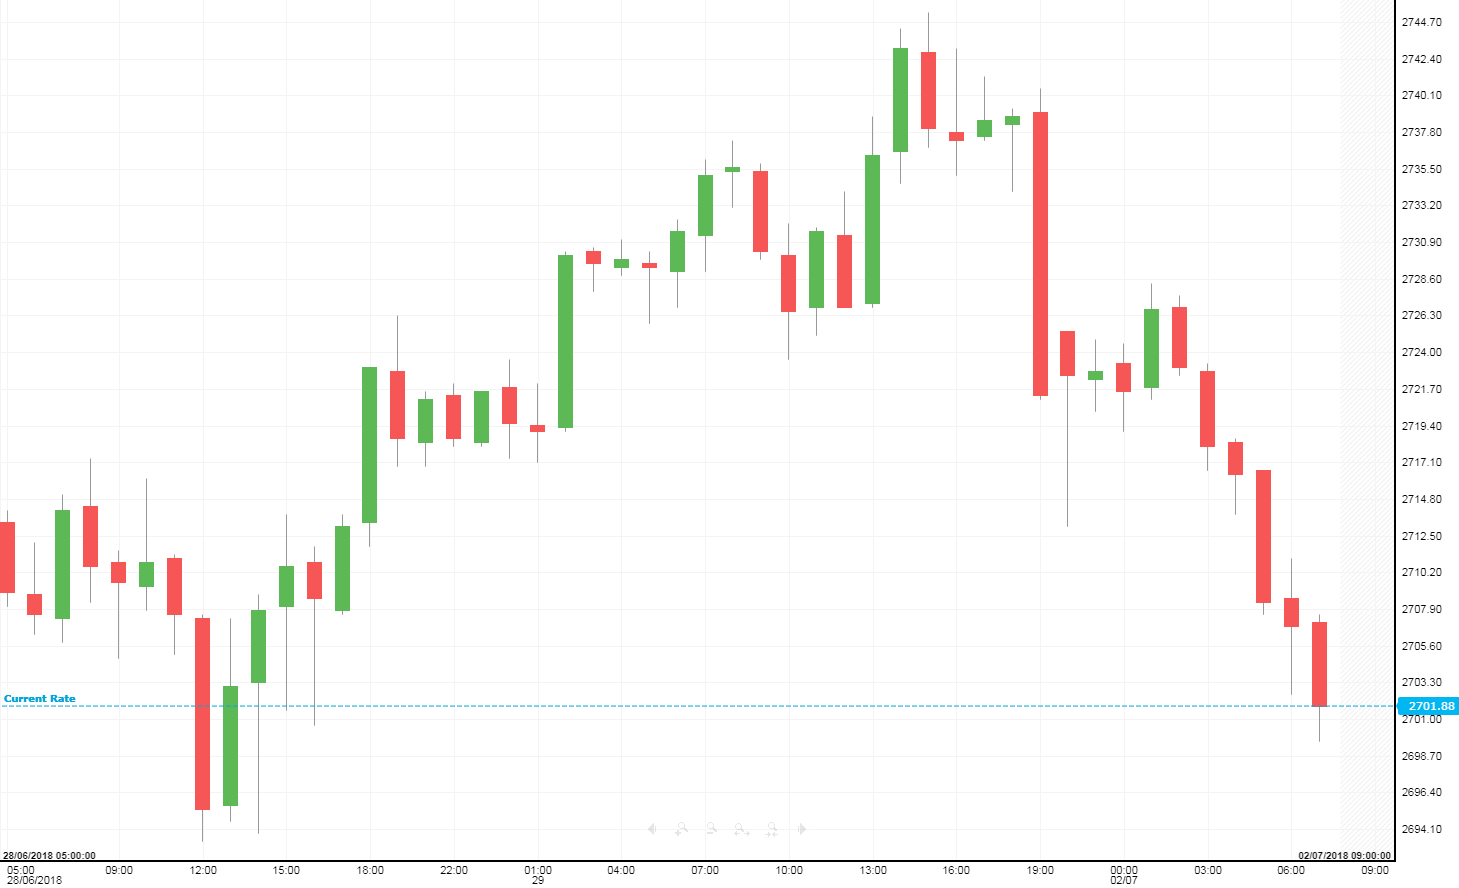
US equity indices closed almost unchanged in the volatile trading on Friday, closing the week for the second time in the row lower for the S&P 500 (US 500).
Banks (US Banks ETF -0.38%) were overall some of the worst performing stocks on Friday, while biotech (US Biotech ETF +1.88%) and energy company stocks (US Energy +0.84%) closed higher.
Nike (NYSE:NKE) (+11.28%) stocks shot higher after the quarterly earnings from Thursday afternoon surpassed market expectations and confirmed that the company was back on track in terms of North American sales.
Wells Fargo (NYSE:WFC) (+3.72%) was supported by the announcement that the Federal Reserve approved its capital plan for 2018 and included a significant increase bank’s buyback authorization.
On Monday in the US ISM Manufacturing Index, Manufacturing PMI and Construction Spending numbers are set to be released.

Pivot: 2728
Support: 2705 2693 2679
Resistance: 2728 2737 2745
Scenario 1: short positions below 2728.00 with targets at 2705.00 & 2693.00 in extension.
Scenario 2: above 2728.00 look for further upside with 2737.00 & 2745.00 as targets.
Comment: the RSI advocates for further decline. The 20-period moving average crossed below the 50-period one.
