Get 40% Off
⚠ Earnings Alert! Which stocks are poised to surge?
See the stocks on our ProPicks radar. These strategies gained 19.7% year-to-date.
Unlock full list

If This Is The Best Stocks Have To Offer, There Is Going To Be A Problem

Published 03/30/2021, 02:32 AM

The S&P 500 finished the day yesterday down about 10 bps, and the Invesco QQQ Trust (NASDAQ:QQQ)s finished the day lower by just 3 bps. But the real story was in the Russell, which continues to get hammered, falling almost 2.8%. The small-cap index traded around resistance all day at 2,175.
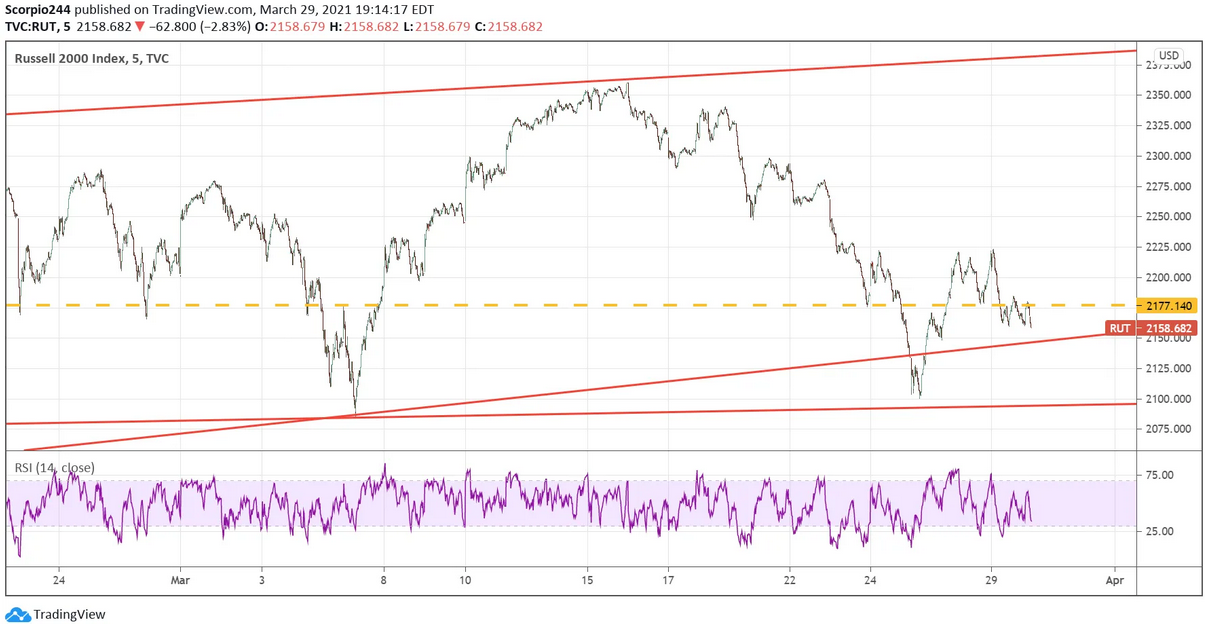
Russell 2000 Index Chart

S&P 500

There was really not much to say about the S&P 500 yesterday, with the index remaining in the same range it has been in since the middle of February, with the upper end of the range of the Futures at 3,960.
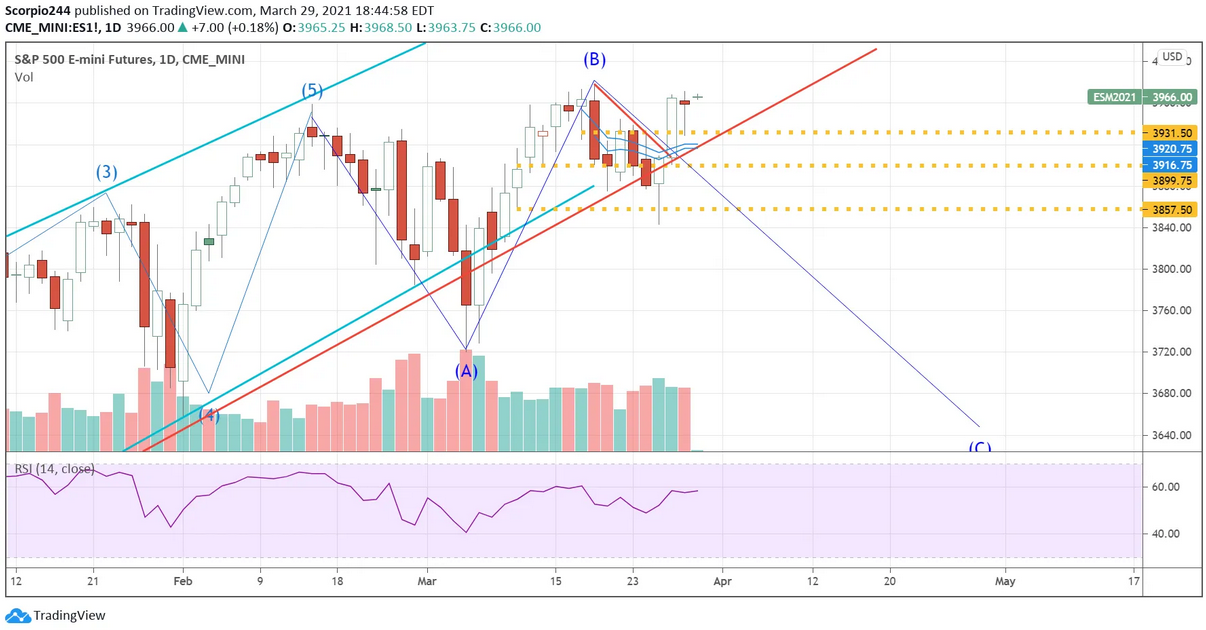
S&P 500 Emini Futures Daily Chart

VIX

The VIX also finished the day at 20.7. So the VIX and the S&P 500 futures continue to hang in the 20s and 3,960 regions, as noted so many times previously, as the upper end of the range. It didn’t look great on Friday, but who knows, maybe it is the right call, and this the top.

It was hardly a good day with the best performing sectors defensive in nature. Utilities, staples, and health care made up 3 of the top 4 performing sectors. After the communication sector’s beating last week, yesterday's strong performance for the group is hardly noteworthy. If these are the sectors left to perform the best in the market, there will be serious issues.

Best Performing Sectors

Options

Call option volume continued to dissipate, and as I have said before, this will be a big problem for the NASDAQ and technology names going forward.
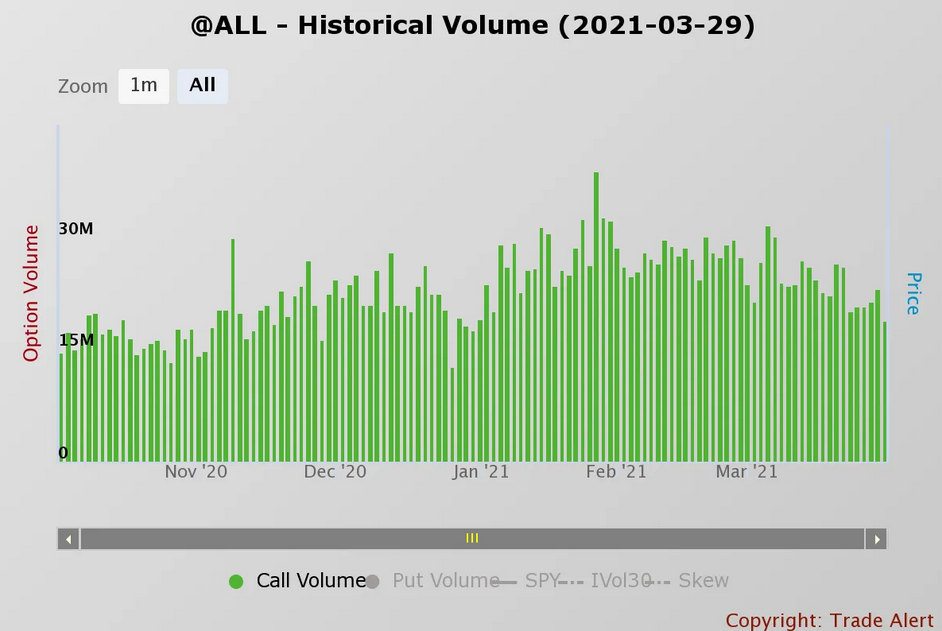
Option Historical Volume

Biotech

The SPDR® S&P Biotech ETF (NYSE:XBI) looks scary, with a descending triangle pattern. The next level of support comes around $127.
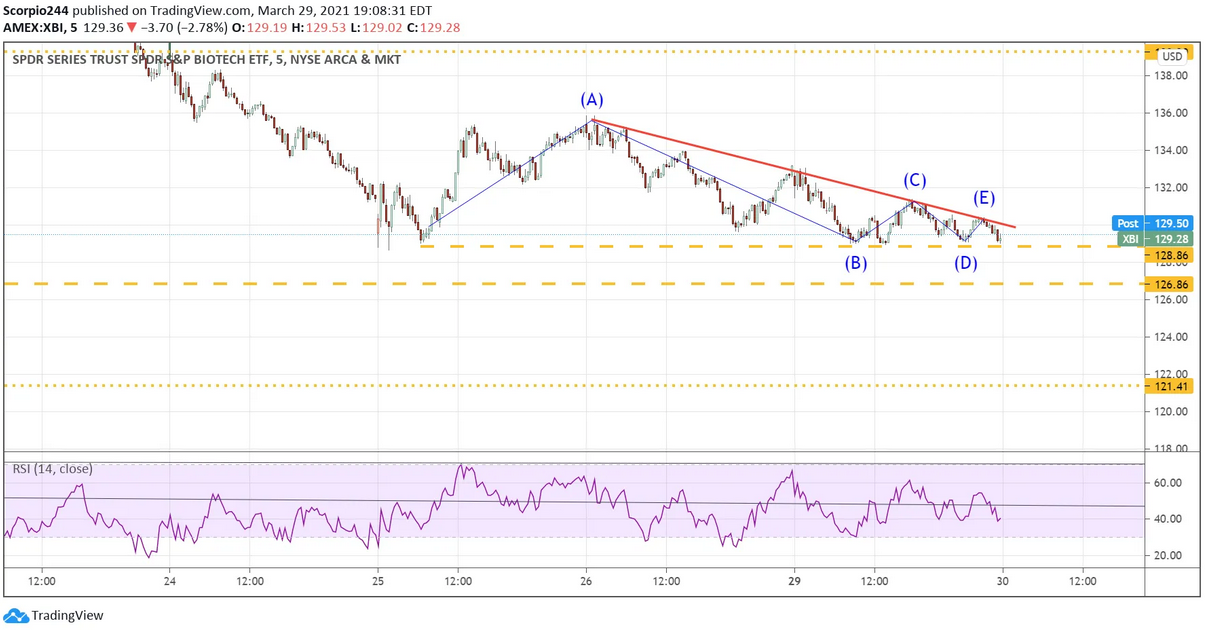
XBI Chart

Costco

Costco Wholesale Corp (NASDAQ:COST) was at an interesting point. The stock had raced off the lows and was close to resistance at $356. The stock went from oversold to nearly overbought in a straight line. Does it breakthrough and race back to the highs, or does it fail and push lower? Tough call; I’m just going to watch.
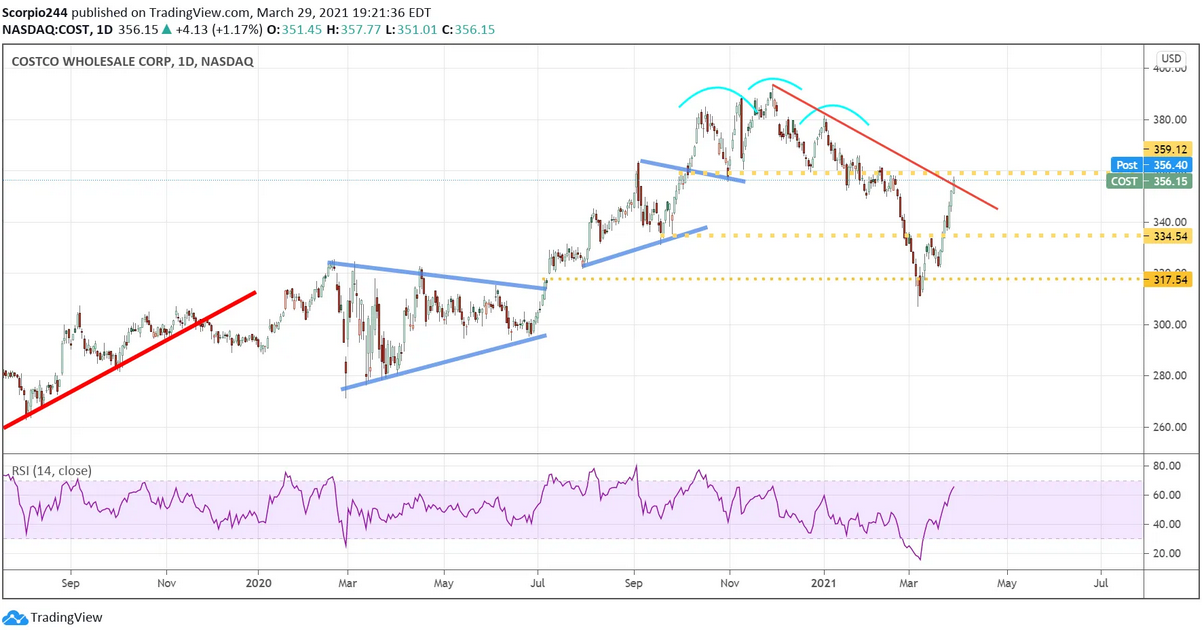
Costco Wholesale Corp Daily Chart

IBM

Was that a giant inverse head and shoulders on IBM? Does IBM’s stock go up? It hasn’t gone up since 2013! I’m not sure about the up thing, but it certainly looks like a head and shoulder pattern, potentially pushing higher towards $148.
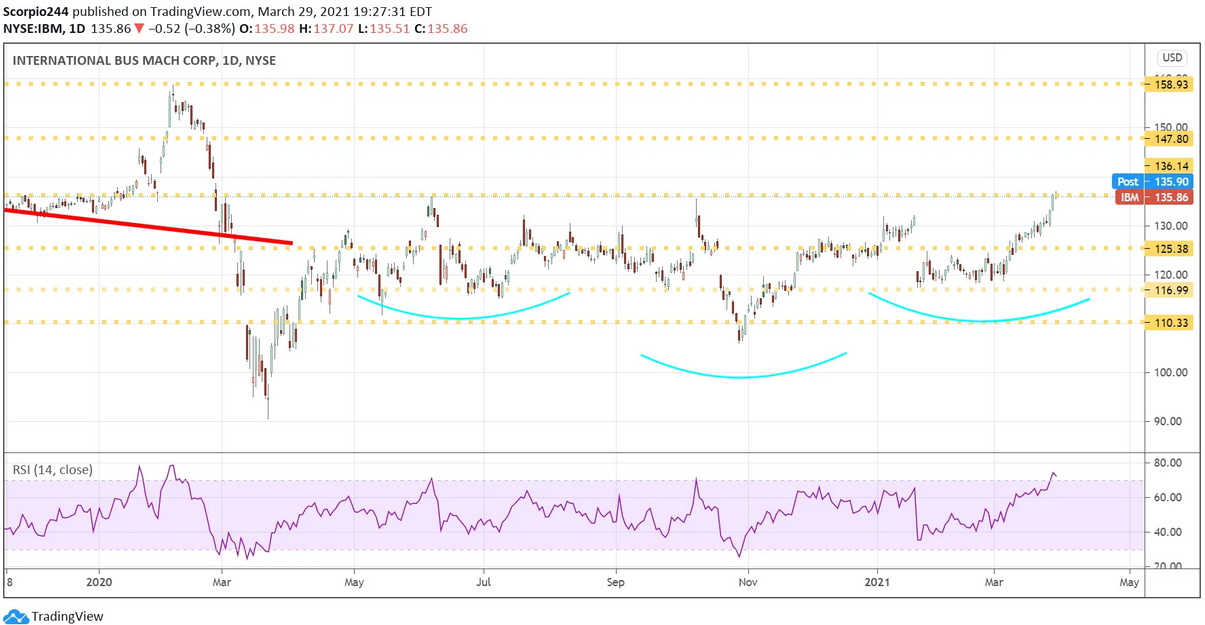
IBM Daily Chart

JD

The RMB was starting to weaken versus the dollar, and that is never a good thing for JD.com's (NASDAQ:JD) stock. There was a giant gap that needs some filling down around $67.30.
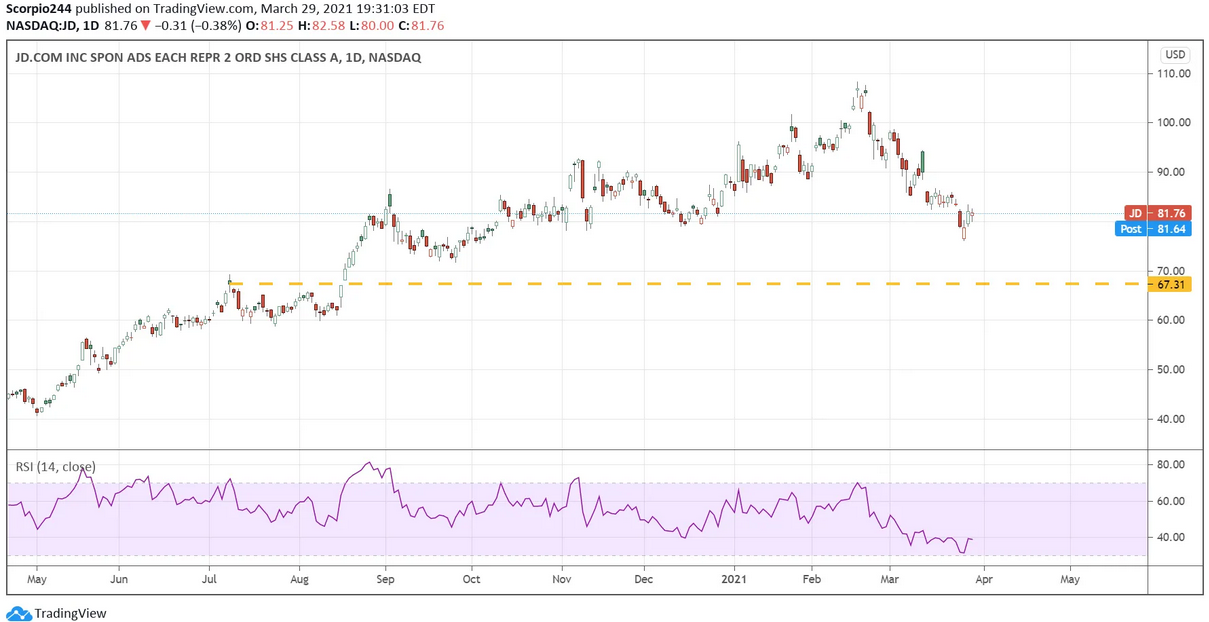
JD.COM Inc Daily Chart

Apple

Apple (NASDAQ:AAPL) doesn’t look great here, and I think there is a good chance this stock heads to $110, maybe lower.
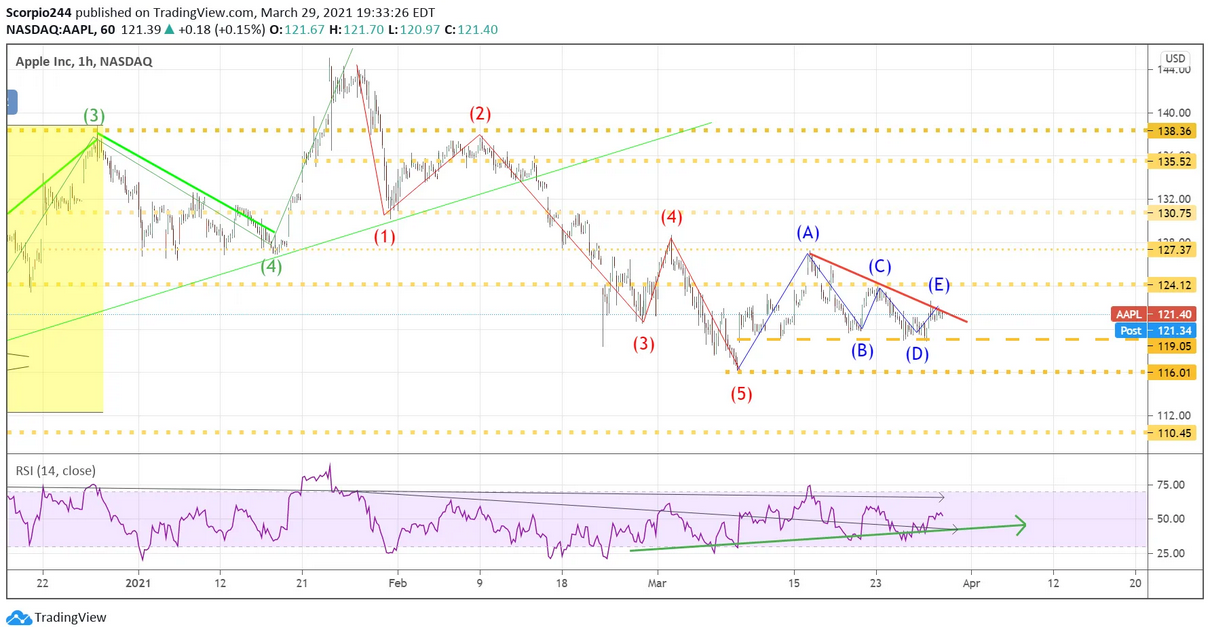
Apple Inc 1-Hr Chart

Original Post

Latest comments

ok
thanks Michael!
cheers!
Risk Disclosure: Trading in financial instruments and/or cryptocurrencies involves high risks including the risk of losing some, or all, of your investment amount, and may not be suitable for all investors. Prices of cryptocurrencies are extremely volatile and may be affected by external factors such as financial, regulatory or political events. Trading on margin increases the financial risks.
Before deciding to trade in financial instrument or cryptocurrencies you should be fully informed of the risks and costs associated with trading the financial markets, carefully consider your investment objectives, level of experience, and risk appetite, and seek professional advice where needed.
Fusion Media would like to remind you that the data contained in this website is not necessarily real-time nor accurate. The data and prices on the website are not necessarily provided by any market or exchange, but may be provided by market makers, and so prices may not be accurate and may differ from the actual price at any given market, meaning prices are indicative and not appropriate for trading purposes. Fusion Media and any provider of the data contained in this website will not accept liability for any loss or damage as a result of your trading, or your reliance on the information contained within this website.
It is prohibited to use, store, reproduce, display, modify, transmit or distribute the data contained in this website without the explicit prior written permission of Fusion Media and/or the data provider. All intellectual property rights are reserved by the providers and/or the exchange providing the data contained in this website.
Fusion Media may be compensated by the advertisers that appear on the website, based on your interaction with the advertisements or advertisers.
© 2007-2024 - Fusion Media Limited. All Rights Reserved.