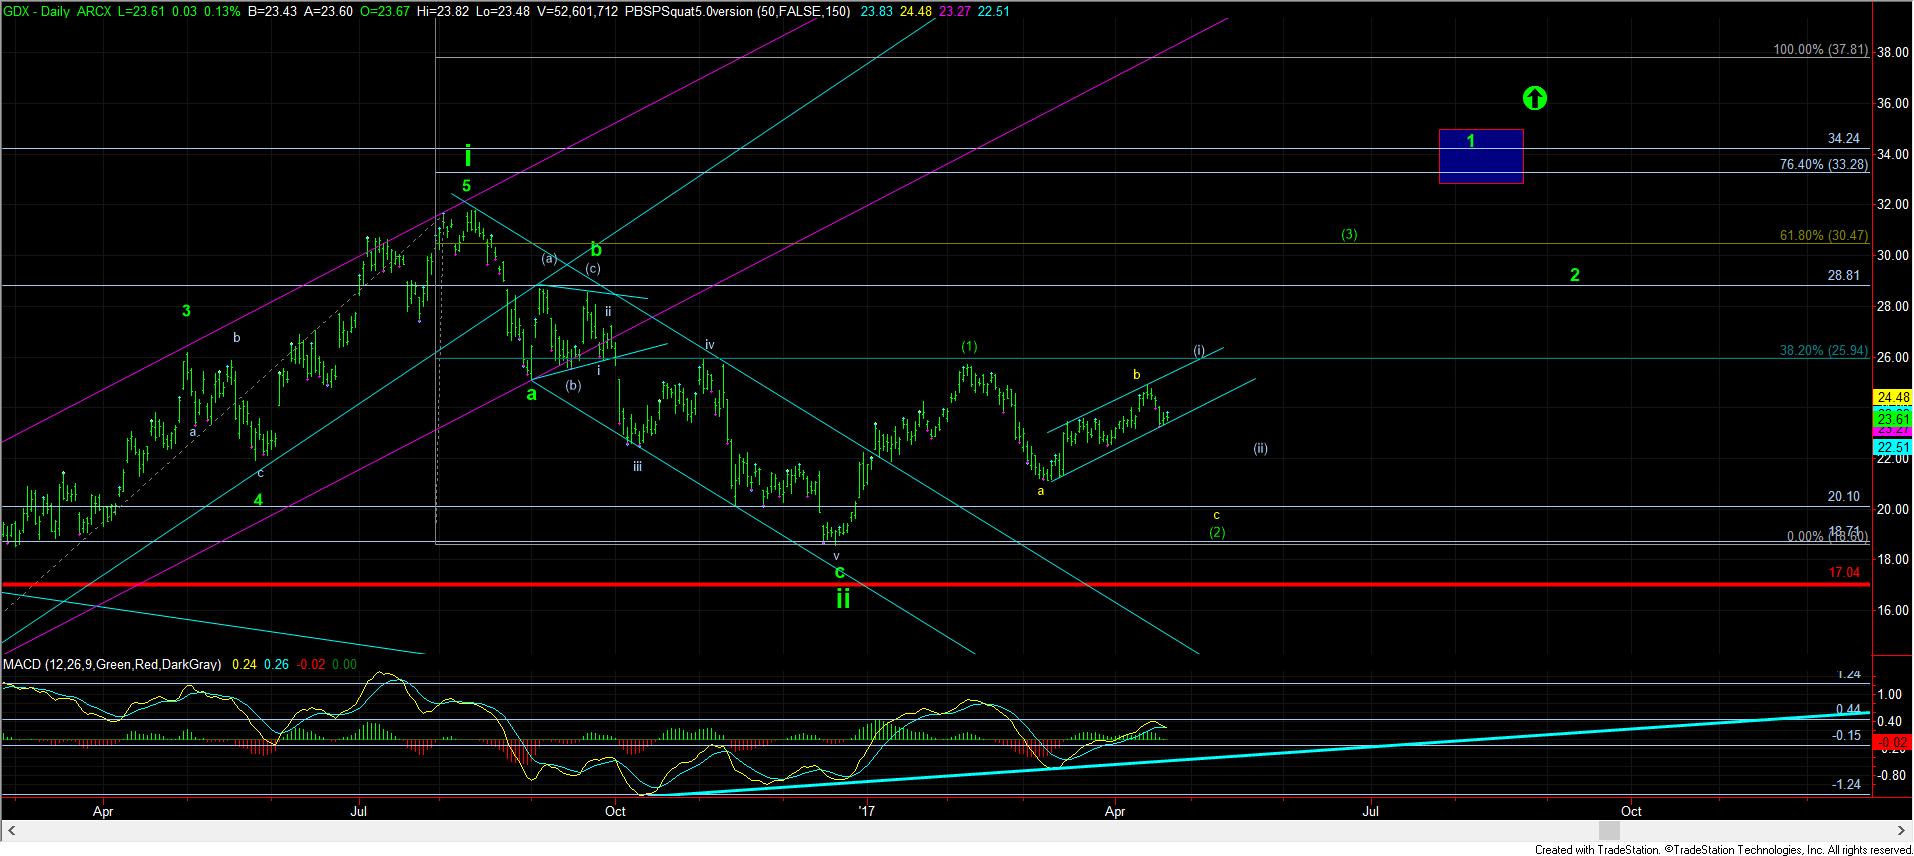
With the VanEck Vectors Gold Miners (NYSE:GDX) breaking below the 24 level this past week, it has strongly suggested that it is not yet ready for a parabolic run. And, as I noted during the mid-week update, it even opens the door to another drop below the March lows before the parabolic run begins:

“. . . the issue I have with it is that the high was struck into an a=c target, which most often denotes a corrective rally. It is for that reason that I wanted to see the .618 extension of that rally hold so that I can continue to view it as an impulsive structure. But, Fibonacci Pinball suggests that once that .618 extension breaks resoundingly, the greater probabilities shift towards that rally being a corrective rally. For this reason, I am viewing the yellow count now as a much stronger potential.”
“Moreover, I will note that if we can see a higher high made in the GDX in the coming week, then I can consider the pattern as a leading diagonal up for a wave (i) as modified on the daily chart. Yes, I know this has gotten more complex than I had wanted, but I am trying to maintain an open mind to the potential I am seeing in the market.”
As of the weekend, my perspective on GDX remains the same.
But, I even have an issue with the more immediately “bearish” yellow count on the chart. You see, c-waves are 5 wave impulsive structures the great majority of the time. However, the drop off the prior week’s high is not easily counted as a 5 wave structure, but looks more like an a-b-c structure down into a region wherein a=c.
So, while the rally counts well as an a=c structure, I also have no clear impulsive structure to the downside wherein I can confidently suggest that we are going to drop to the 20-21 region. Ultimately, this leaves me in a position where I have to maintain a hedge on my long term portfolio until we are able to break out over the prior week’s high, due to the potential for us heading back down to the 20-21 region in a larger wave (2) pullback.

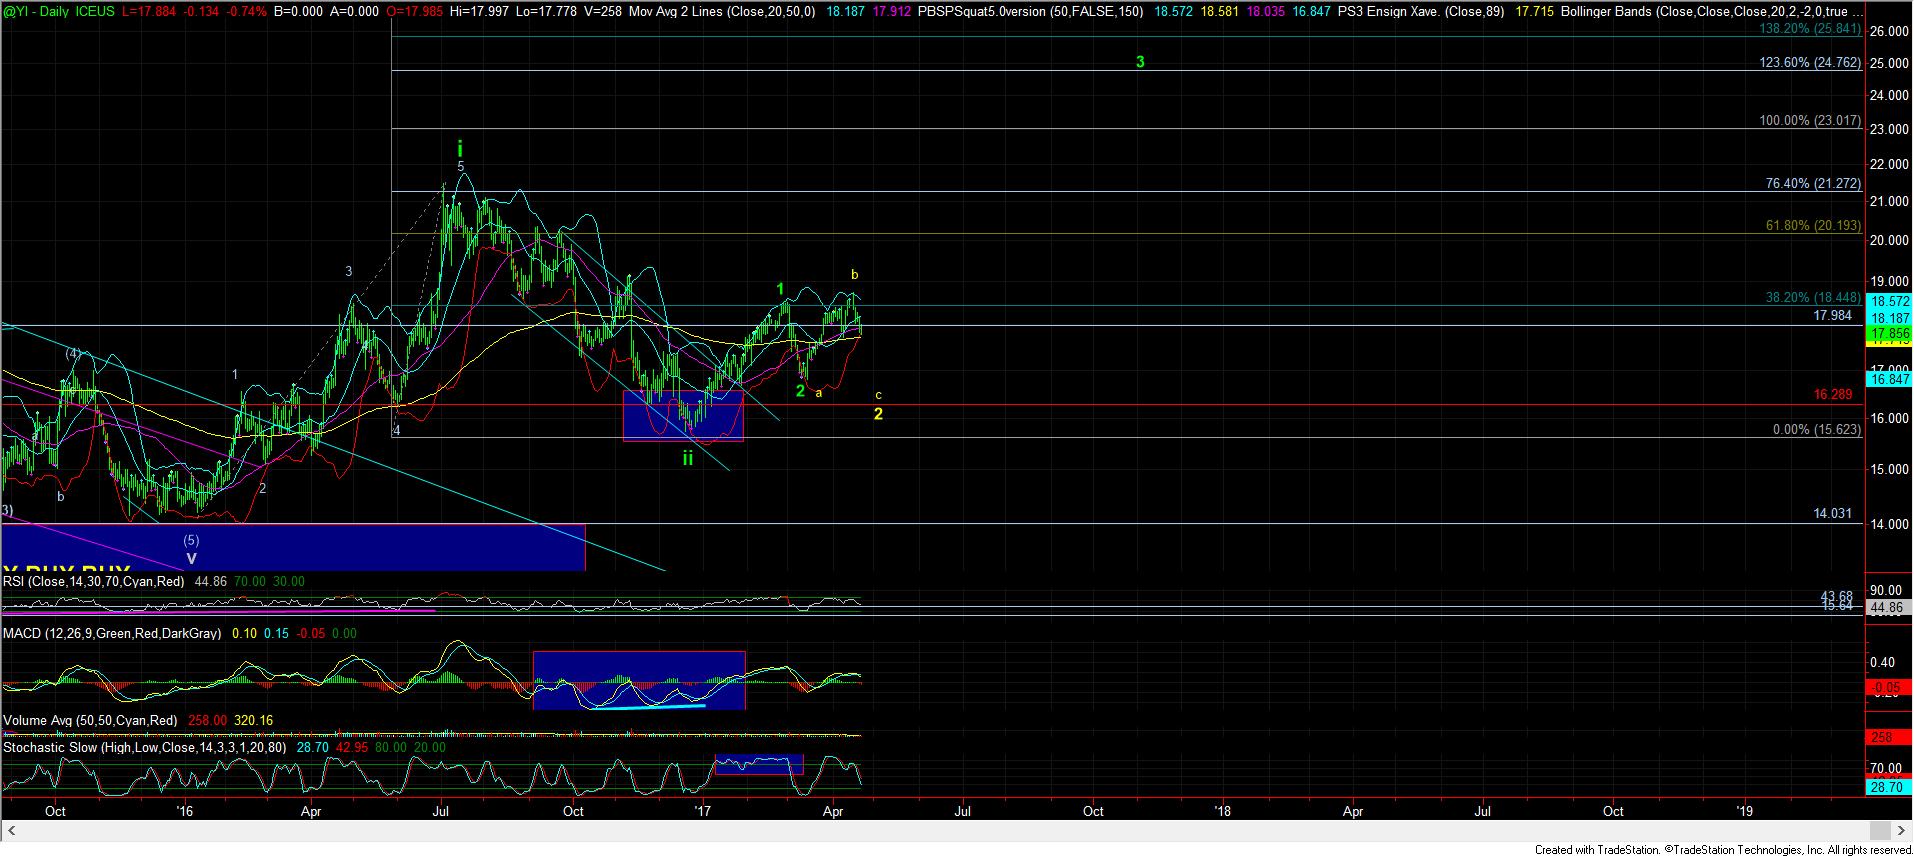
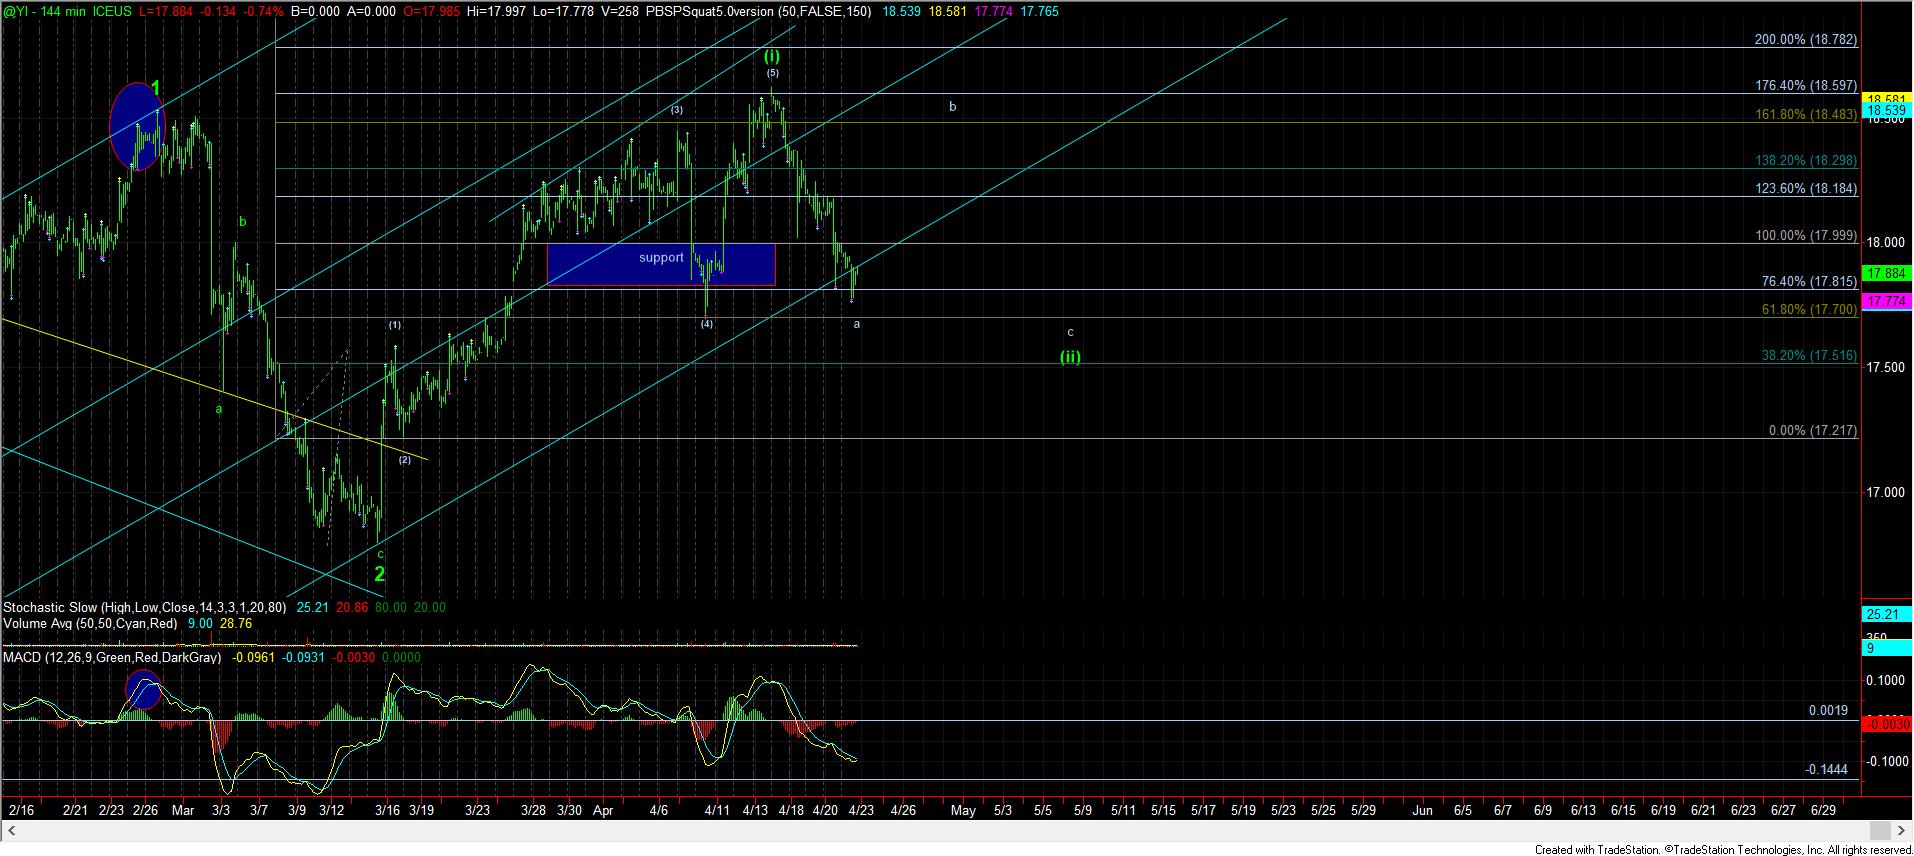
As far as silver is concerned, I noted a possible pattern on Friday which would be an “evil” set up for the market, but I have no clear indications it is playing out just yet. But, it is something I think you need to watch:

If I may be EVIL for a moment, I would LOVE to see a b-wave rally back up towards the highs in silver, to set up a c-wave drop for an ideal wave (ii). In fact, this will likely scare most of the market as they brace themselves for a break-down of an H&S pattern, but which will just trigger a 3rd wave back up. Again, I am getting wayyyyyyyy ahead of myself, but I would love to see it play out like this.
And, if you remember, I made a similar call on GDX back in the fall of last year, which set up the exact same type of whipsaw which led to the rally we experienced earlier this year in GDX. But, this time, the rally, if it sets up in this fashion, would be much more powerful and would cause much more chasing.

As far as the micro pattern is concern, as long as silver remains over the 17.40/17.50 region, I can maintain the expectation of a b-wave rally. However, should we see a break-down of that region, then I would have to adopt the yellow count on the attached silver daily chart, which would suggest we test the March lows again in a larger wave (ii) pullback.
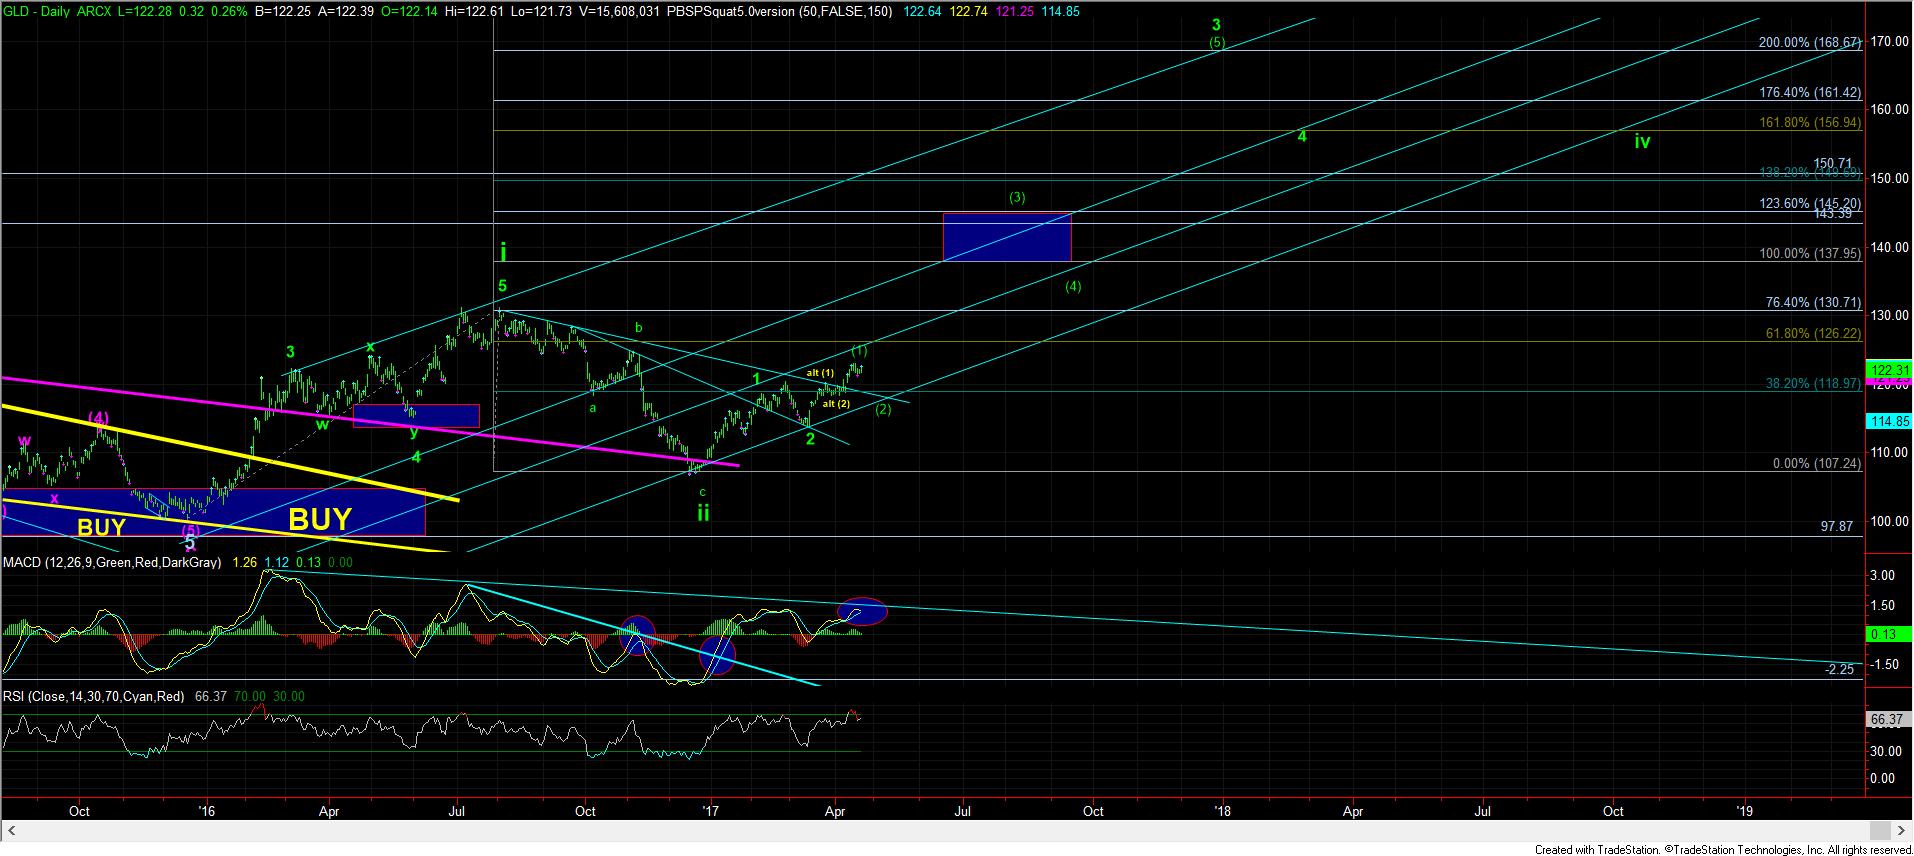
With regard to the SPDR Gold Shares (NYSE:GLD), I still think we can see more downside consolidation before the wave (3) takes hold later this year. As long as we remain below the 126 region in the GLD, I am going to be expecting more consolidation in the coming weeks, with the potential for a drop back towards the converting trend lines for a bigger wave (2). However, once we see the market strongly take out the 126 region, I am going to assume we are in the heart of wave (3), with a minimum target in the 138 region.
In conclusion, as I have noted the last few weeks, I think this pullback can still take a bit more time before we are ready for the next big upside move in the complex. And, as long as the GDX remains below the highs it made a little over a week ago, there is strong potential that we can test or even break just below the March lows before the next strong move higher is ready.
But, please do not mistake me for being bearish. I still believe that we are going to see much higher levels in 2017, even if we see a deeper pullback into May. So, do not lose sight of the forest while you are analyzing some leaves.
