
Huntsman Corporation (NYSE:HUN) swung to a profit of $308 million or $1.34 per share in fourth-quarter 2019 from a loss of $315 million or $1.43 in the year-ago quarter.
Barring one-time items, adjusted earnings per share were 29 cents in the quarter, down from 38 cents in the year-ago quarter. The figure topped the Zacks Consensus Estimate of 28 cents.
Revenues were $1,657 million, down around 9% year over year. However, it surpassed the Zacks Consensus Estimate of $1,584.7 million. The company saw lower sales across its business segments in the reported quarter. It witnessed lower volumes and prices in most of its businesses.
Huntsman Corporation Price, Consensus and EPS Surprise
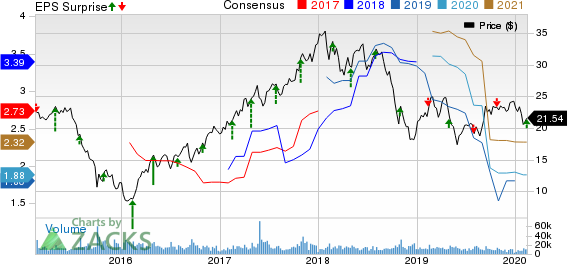
Huntsman Corporation price-consensus-eps-surprise-chart | Huntsman Corporation Quote
Full-Year Results
Earnings for 2019 were $2.44 per share, up from $1.39 per share a year ago. Adjusted earnings per share for the year were $1.53, down from $2.66 a year ago.
Revenues were $6,797 million for the full year, down around 11% year over year.
Segment Highlights
Polyurethanes: Revenues in the segment fell 3% year over year to $980 million due to lower MDI (methylene diphenyl diisocyanate) average selling prices, which were partly offset by higher MDI sales volumes.
Performance Products: Revenues in the unit declined 10% to $278 million due to reduced average selling prices as well as lower sales volumes.
Advanced Materials: Revenues in the unit dropped 9% to $241 million due to lower average selling prices and sales volumes.
Textile Effects: Revenues in the division were down 7% to $180 million. The decline was due to lower sales volumes and average selling prices. Volumes were affected by softer demand as a result of uncertainties surrounding the trade conflict.
Financials
Huntsman had total cash of $525 million at the end of 2019, up around 54% year over year. Long-term debt was $2,177 million, down around 2% year over year.
Net cash provided by operating activities from continuing operations was $656 million in 2019 compared with net cash provided by operating activities of $704 million in 2018. Huntsman generated free cash flow of $389 million in 2019 compared with $454 million a year ago.
The company repurchased around 10.1 million shares worth roughly $208 million in 2019.
Outlook
Moving ahead, Huntsman noted that it will remain focused, in 2020, on investing in its downstream and specialty platforms both through acquisitions and organically. It will also remain balanced in its capital allocation including opportunistic share repurchases and maintaining a competitive dividend.
For the Polyurethanes unit, Huntsman expects demand headwinds in several major markets and regions in 2020. It also anticipates differentiated MDI margins to be stable.
For Performance Products, the company sees growth in performance amines. It also expects weak demand in the maleic anhydride with stable margins.
For Advanced Materials, the company expects stable overall margins amid weakness in industrial markets and demand headwind in aerospace.
For Textile Effects unit, Huntsman expects growth in specialty products. It also sees stable volumes and improved margins.
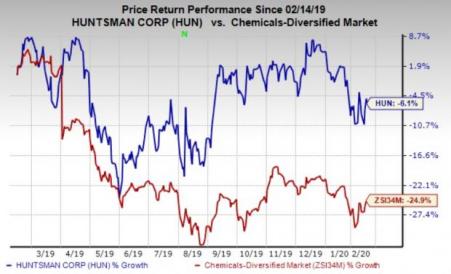
Price Performance
Huntsman's shares are down 6.1% in the past year against the industry’s 24.9% decline.
Zacks Rank & Key Picks
Huntsman currently carries a Zacks Rank #3 (Hold).
Some better-ranked stocks in the basic materials space include Daqo New Energy Corp. (NYSE:DQ) , Agnico Eagle Mines Limited (NYSE:AEM) and NovaGold Resources Inc. (NYSE:NG) .
Daqo New Energy has projected earnings growth rate of 326.3% for 2020 and sports a Zacks Rank #1 (Strong Buy). The company’s shares have surged roughly 104% in a year’s time. You can see the complete list of today’s Zacks #1 Rank stocks here.
Agnico Eagle has estimated earnings growth rate of 91.7% for 2020 and carries a Zacks Rank #1. The company’s shares have shot up roughly 41% in a year’s time.
NovaGold has projected earnings growth rate of 11% for the current fiscal and carries a Zacks Rank #1. The company’s shares have surged around 146% over a year.
Looking for Stocks with Skyrocketing Upside?
Zacks has just released a Special Report on the booming investment opportunities of legal marijuana.
Ignited by new referendums and legislation, this industry is expected to blast from an already robust $6.7 billion to $20.2 billion in 2021. Early investors stand to make a killing, but you have to be ready to act and know just where to look.
See the pot trades we're targeting>>
Huntsman Corporation (HUN): Free Stock Analysis Report
Agnico Eagle Mines Limited (AEM): Free Stock Analysis Report
DAQO New Energy Corp. (DQ): Free Stock Analysis Report
Novagold Resources Inc. (NG): Free Stock Analysis Report
Original post
Zacks Investment Research