
It should be obvious that China's economy has turned the corner. While we may not necessarily see gang buster growth, the risks of a hard landing are diminishing fast (see my previous posts China dodges a bullet? and Is the World Bank's downgrade of China's growth the nadir?).
The Worst Is Over
The chart below of Chinese stocks (as represented by FXI) compared to the MSCI All-Country World Index (ACWI) shows that FXI rallied through a relative downtrend line in October, indicating that the worst is over for Chinese stocks. Moreover, FXI has retreated to test the downtrend line, which is now relative support, and this represents a good entry point for China bulls.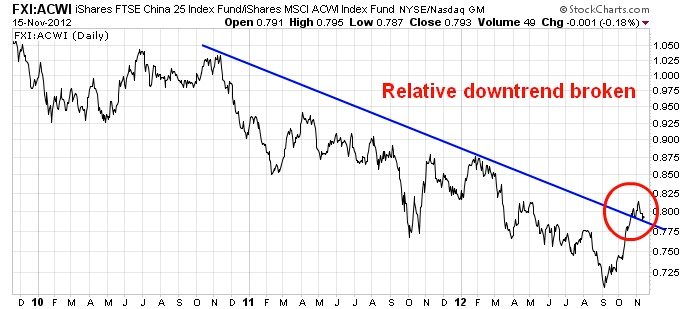
Given the volatility of Chinese stocks due to the uncertainty in political climate and weak corporate governance, a better way to play a rebound in Chinese growth may be through the markets of China's regional trading partners. The chart below of MSCI Pacific Ex-Japan (EPP) relative to ACWI shows that EPP is in a more robust relative uptrend. There is a short dated relative uptrend (dotted line) that began in October, which is supported by a longer dated relative uptrend (solid line) that began in May when EPP bottomed on a relative basis.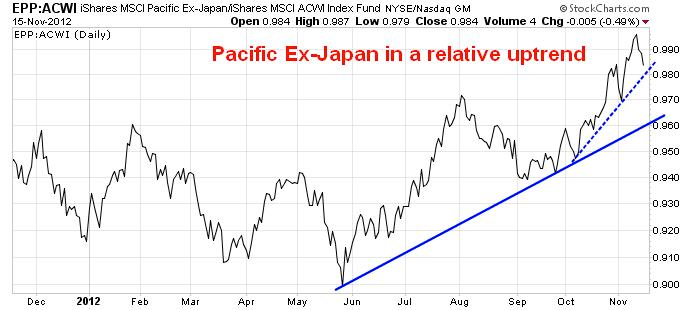
The Australian Play
Another way to play China's rebound is through Australian equities, such as EWA. A glance at APP's top-10 stocks shows that nine of them are Australian, which indicates that the Aussie market has the heaviest influence in EPP.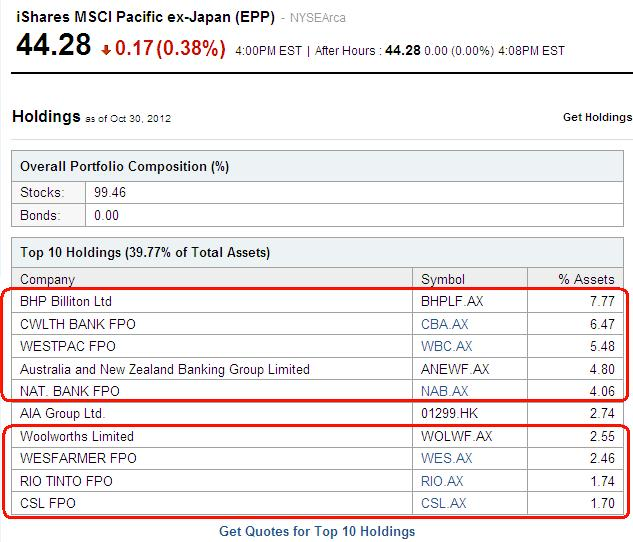
One can also gain exposure through the Hong Kong ETF (EWH). The chart of EWH vs. ACWI below shows that Hong Kong equities staged a relative breakout in late September and have been in a well=defined relative uptrend since. EWH does appear to be a tad overextended in the short-term, though.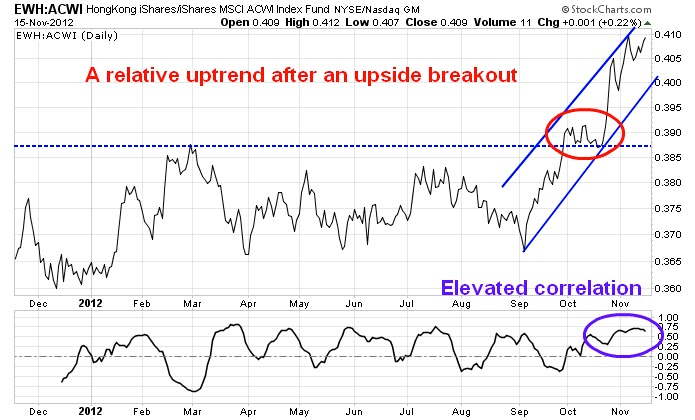
Buy Both
Another way to diversify your exposure is to buy both Australia and Hong Kong. The bottom panel of the above chart shows the correlation between EWA and EWH, which currently stands at 0.62. While that is an elevated reading, keep in mind that is roughly the long-term correlation between stocks and bonds and therefore positions in those two ETFs should provide an adequate level of diversification while maintaining an exposure to the China bull story.
None of the information or opinions expressed in this blog constitutes a solicitation for the purchase or sale of any security or other instrument. Nothing in this article constitutes investment advice and any recommendations that may be contained herein have not been based upon a consideration of the investment objectives, financial situation or particular needs of any specific recipient. Any purchase or sale activity in any securities or other instrument should be based upon your own analysis and conclusions. Past performance is not indicative of future results. Either Qwest or Mr. Hui may hold or control long or short positions in the securities or instruments mentioned.
- English (UK)
- English (India)
- English (Canada)
- English (Australia)
- English (South Africa)
- English (Philippines)
- English (Nigeria)
- Deutsch
- Español (España)
- Español (México)
- Français
- Italiano
- Nederlands
- Português (Portugal)
- Polski
- Português (Brasil)
- Русский
- Türkçe
- العربية
- Ελληνικά
- Svenska
- Suomi
- עברית
- 日本語
- 한국어
- 简体中文
- 繁體中文
- Bahasa Indonesia
- Bahasa Melayu
- ไทย
- Tiếng Việt
- हिंदी
How To Play China's Rebound
Published 11/16/2012, 08:50 AM
Updated 07/09/2023, 06:31 AM
How To Play China's Rebound
3rd party Ad. Not an offer or recommendation by Investing.com. See disclosure here or
remove ads
.
Latest comments
Install Our App
Risk Disclosure: Trading in financial instruments and/or cryptocurrencies involves high risks including the risk of losing some, or all, of your investment amount, and may not be suitable for all investors. Prices of cryptocurrencies are extremely volatile and may be affected by external factors such as financial, regulatory or political events. Trading on margin increases the financial risks.
Before deciding to trade in financial instrument or cryptocurrencies you should be fully informed of the risks and costs associated with trading the financial markets, carefully consider your investment objectives, level of experience, and risk appetite, and seek professional advice where needed.
Fusion Media would like to remind you that the data contained in this website is not necessarily real-time nor accurate. The data and prices on the website are not necessarily provided by any market or exchange, but may be provided by market makers, and so prices may not be accurate and may differ from the actual price at any given market, meaning prices are indicative and not appropriate for trading purposes. Fusion Media and any provider of the data contained in this website will not accept liability for any loss or damage as a result of your trading, or your reliance on the information contained within this website.
It is prohibited to use, store, reproduce, display, modify, transmit or distribute the data contained in this website without the explicit prior written permission of Fusion Media and/or the data provider. All intellectual property rights are reserved by the providers and/or the exchange providing the data contained in this website.
Fusion Media may be compensated by the advertisers that appear on the website, based on your interaction with the advertisements or advertisers.
© 2007-2024 - Fusion Media Limited. All Rights Reserved.