This article was written exclusively for Investing.com
Stocks around the globe have been off to the races since March. Call it a liquidity fed, momentum-driven rally that has sent companies with the fastest earnings growth rates to some of the highest valuations in decades. Even the S&P 500 has seen its PE ratio soar to well over 20, based on 2021 earnings estimates.
Blame it on the ultra-low rates brought on by aggressive monetary policy in the face of the coronavirus pandemic. It has left investors scrambling for new ways to value stocks and the overall market. But just because those creative metrics have helped push the market higher, it doesn't change the situation's reality, that stocks are historically overvalued.
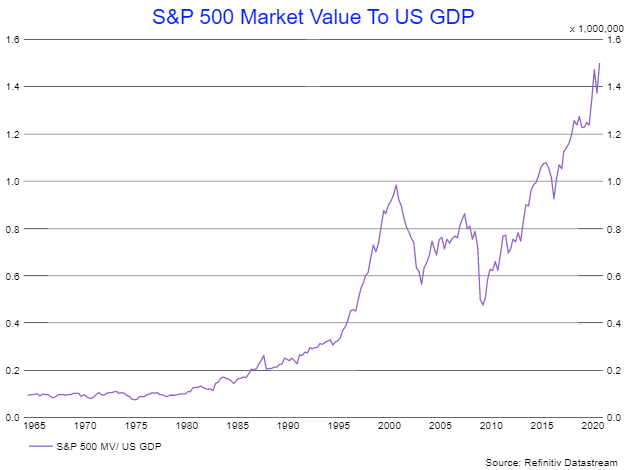
S&P 500 To US GDP
Consider that the S&P 500 is trading at well over 150% of the US economy's total GDP; it is the highest level ever. And yes, while the US economy's GDP will rebound sharply over the next few years, moving above the 2019 highs of nearly $20 trillion. It is likely to take some time before it climbs to over $30 trillion, which is the market capitalization of the entire S&P 500 today.

Getting Creative
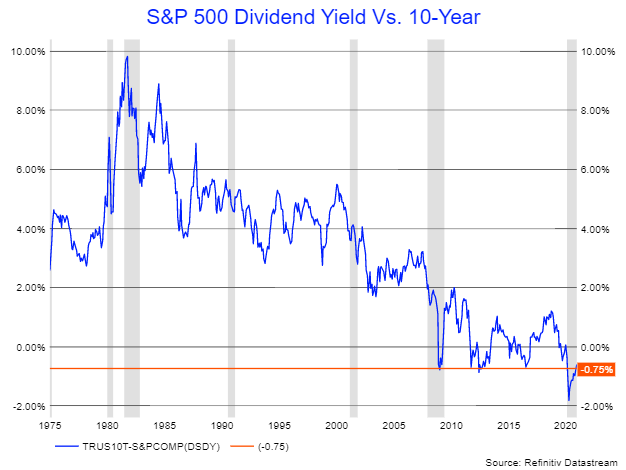
Sure, if we get really creative, one could even argue the S&P 500 should be more than double its current level of 3,700 in this low rate world. Take, for example, the S&P's dividend yield of around 1.5%, which is 60 basis points higher than the 10-year Treasury rate.
Historically, the dividend yield of the S&P 500 has traded at a discount to the 10-year Treasury. Using that logic, the S&P 500 would have to rise an awful lot to get its dividend yield at or below 90 basis points. Over the trailing twelve months, the S&P 500 has a cash dividend of about $58.85, which would mean the S&P 500 would need to rise to around 6,500.

Different Side Of The Same Coin
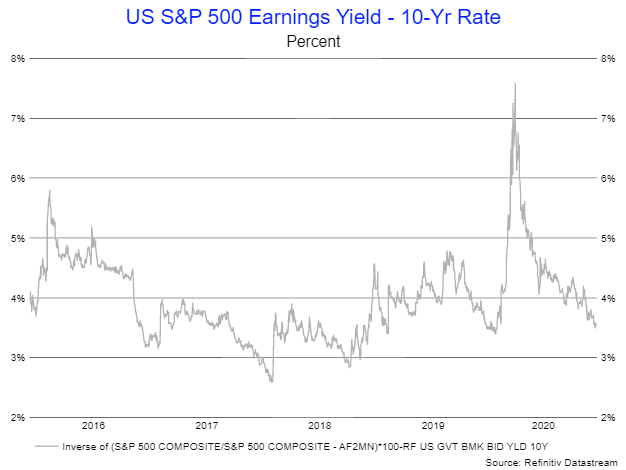
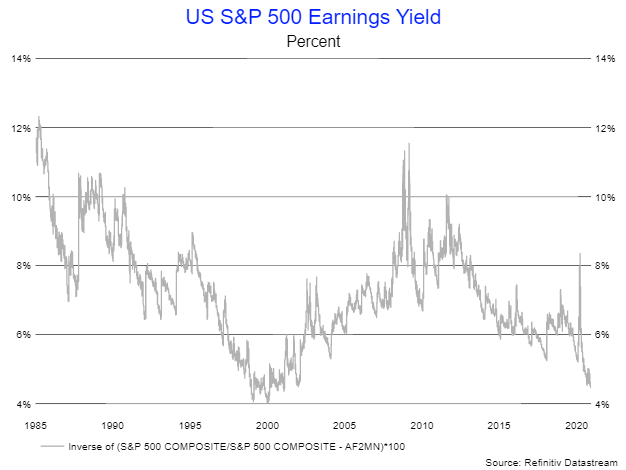
Using an earnings yield method for the S&P 500, one would find the index trades at 4.5% based on earnings estimates of around $165 per share for the S&P 500 in 2021. It values the S&P 500 at roughly 22.5 times those 2021 earnings estimates. But using that earnings yield and comparing it to the 10-Year Treasury rate, we find that the spread is around 3.6%. That spread happens to be precisely in line with where the S&P 500 was trading in January, before the coronavirus pandemic.

But ironically, despite trading at the same valuation compared to the 10-year treasury rate on an earnings yield basis, on a PE ratio basis, the S&P 500 is much more expensive than in January, when it was trading at just 19 times one-year forward earnings estimates.
The Inverse of 1999
It creates an interesting and complex problem. If the earnings multiple of 22 on a forward basis is very expensive. Does it make the low-interest rate adjusted earnings yield correct or sustainable? Has the market come up with a new way to value the S&P 500 and stocks, in general, to justify its incredible push higher.

When looking at it yet another way, today's S&P 500 earnings yield has only been equal to or lower than its current level in one other period since 1985. Of course, it would only make sense that period came in 1999 and 2000.
Ironically or not, this was another period where investors were trying to make sense of the extreme overvaluations in the equity market. Of course, rates were higher during that period. Still, the economy was booming and delivering colossal growth rates, again justifying the high PE ratios, which happens to be the inverse of the earnings yield.
Call it a coincidence if you'd like. But the similarities are startling. The same super-high valuations and a narrative that is precisely the opposite. Using the inverse of the same valuation metric, with the no-growth, low rate world of today, versus the immense growth, high rate world of 1999.
Whether it be a high PE ratio or low earnings yield, it may not matter because it is the same thing, just said a different way.
