
As someone who has been warning heavily about dangerous bubbles in U.S. corporate bonds and stocks, people often ask me how and when I foresee these bubbles bursting. Here’s what I wrote a few months ago:
To put it simply, the U.S. corporate debt bubble will likely burst due to tightening monetary conditions, including rising interest rates. Loose monetary conditions are what created the corporate debt bubble in the first place, so the ending of those conditions will end the corporate debt bubble. Falling corporate bond prices and higher corporate bond yields will cause stock buybacks to come to a screeching halt, which will also pop the stock market bubble, creating a downward spiral. There are extreme consequences from central bank market-meddling and we are about to learn this lesson once again.
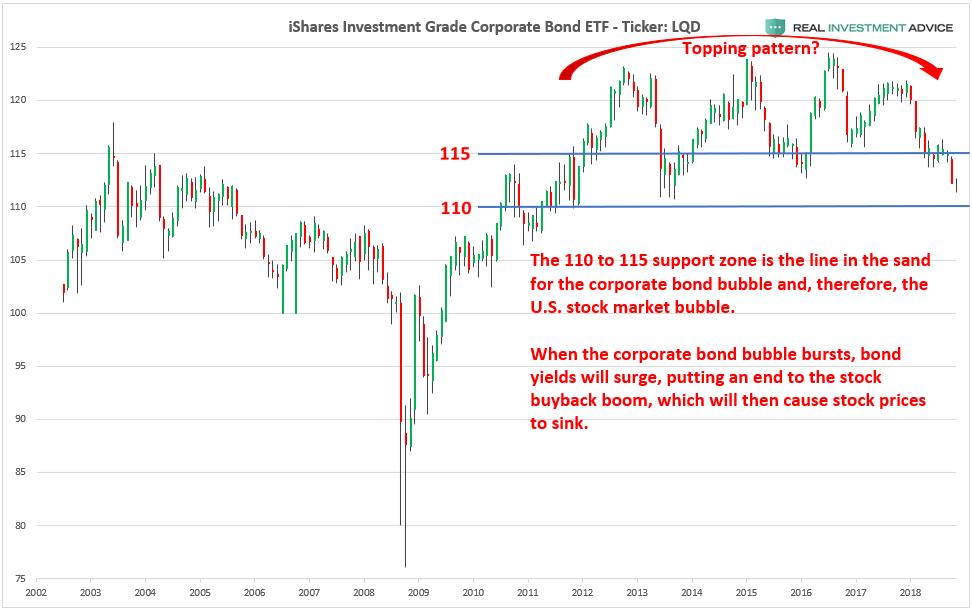
Interestingly, Zero Hedge tweeted a chart today of the iShares iBoxx $ Investment Grade Corporate Bond (NYSE:LQD) saying that it was “about to break 7 year support: below it, the buybacks end.” That chart resonated with me, because it echos my warnings from a few months ago. I decided to recreate this chart with my own commentary on it. The 110 to 115 support zone is the key line in the sand to watch. If LQD closes below this zone in a convincing manner, it would likely foreshadow an even more powerful bond and stock market bust ahead.

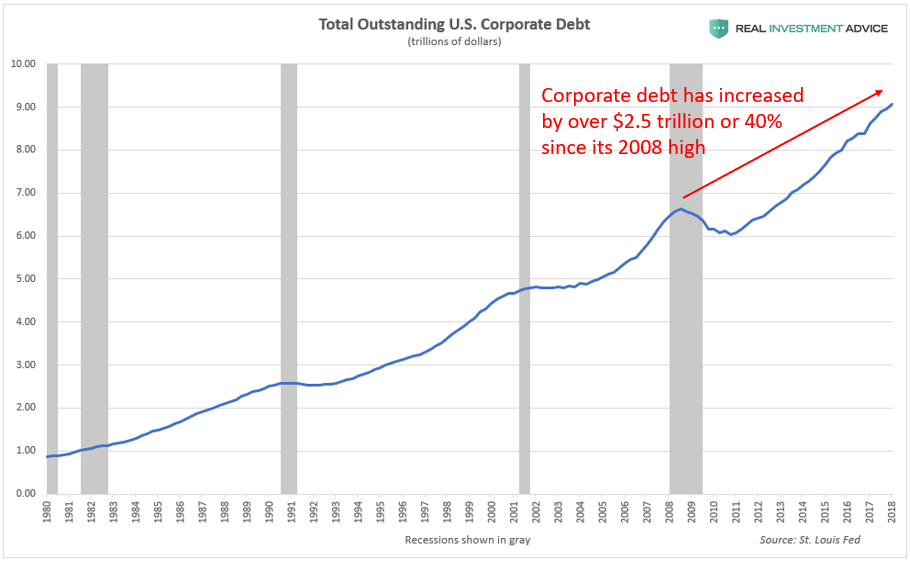
Thanks to ultra-low corporate bond yields, U.S. corporations have engaged in a borrowing binge since the Global Financial Crisis. Total outstanding non-financial U.S. corporate debt is up by an incredible $2.5 trillion or 40 percent since its 2008 peak, which was already a precariously high level to begin with.
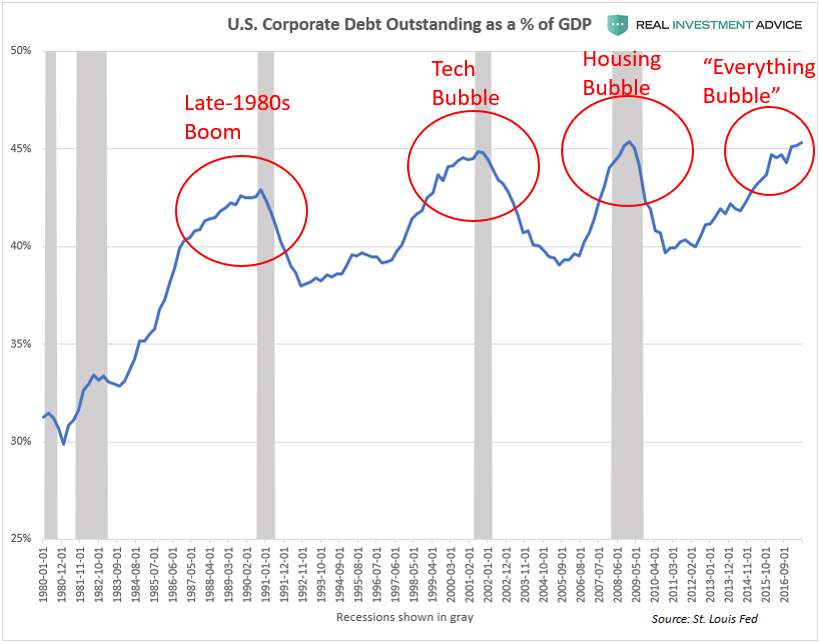
U.S. corporate debt is now at an all-time high of over 45% of GDP, which is even worse than the levels reached during the dot-com bubble and U.S. housing and credit bubble:
Please watch my presentations about the U.S. corporate debt bubble and stock market bubble to learn more:
Billionaire fund manager Jeff Gundlach shares similar concerns as me, saying “The corporate bond market is going to get much worse when the next recession comes. It’s not worth trying to wait for that last ounce of return, or extra yield from the corporate bond market.” Another billionaire investor, Paul Tudor Jones, put out a warning this week, saying “it is in the corporate bond market where the first signs of trouble will emerge.” GE’s terrifying recent credit meltdown may be the initial pinprick for the corporate debt bubble, but make no mistake – it is not an isolated incident. GE may be the equivalent to Bear Stearns in 2007 and 2008 – just one of the first of many casualties. Anyone who thinks that the Fed can distort the credit markets for so long without terrible consequences is extremely naive and will be taught a lesson in the days to come.