Something quite interesting has taken place at the world’s largest gold miner over the past few years. While certain mining costs, like energy, have declined since the price of oil plummeted from over $100 a barrel in 2013 to an average $43 in 2016, quite the opposite has taken place with the cost of labor.
Barrick Gold Corporation (NYSE:ABX), the world’s largest gold miner, is paying a great deal more in labor to produce an ounce of the precious shiny yellow metal than it did just five years ago. How much more? Well, it turns out to be quite a lot.
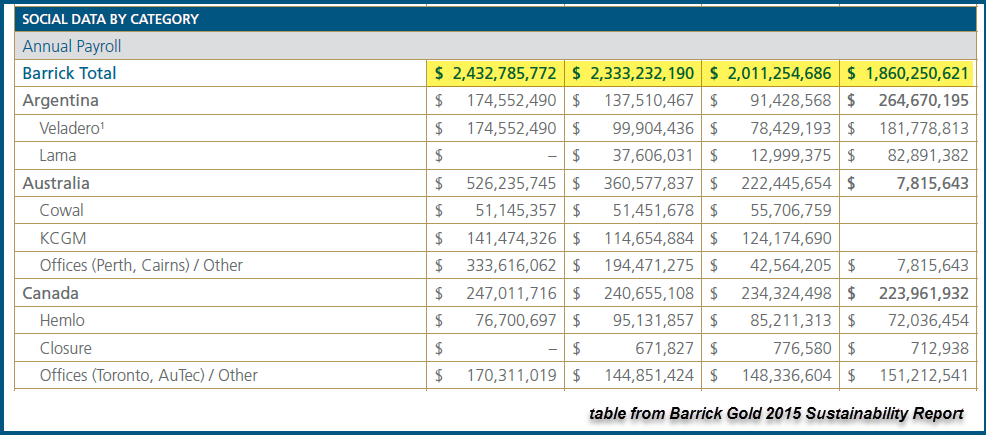
For example, Barrick Gold only paid $1.5 billion in labor costs to produce 7.8 million ounces (Moz) of gold in 2010. However, this increased significantly in 2015, as Barrick paid $1.86 billion in annual payroll to produce 6.1 Moz of gold. While the labor cost only increased $360 million in 2015 versus 2010, total gold production declined by 1.7 Moz.
I took the annual payroll data from Barrick Gold’s Sustainability Reports, shown in the table below:

As we can see in the chart, Barrick’s annual payroll has continued to decline since 2012. However, so has its production. So, if we divide Barrick’s annual payroll by how many ounces of gold the company produced, we end up with a “Labor Cost per ounce.”
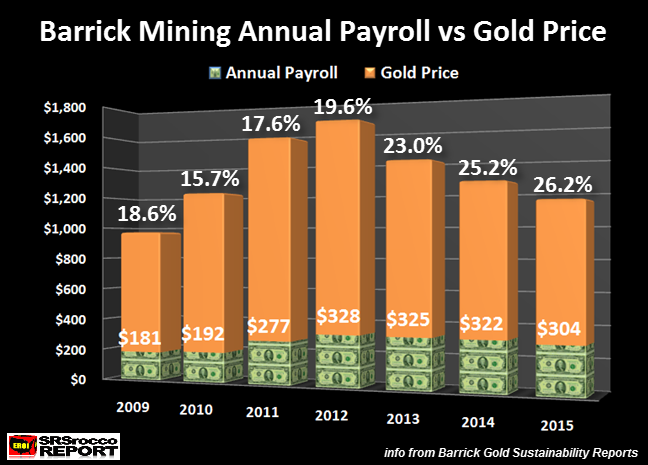
Taking the data from Barrick Gold’s Sustainability Reports since 2009, we can plainly see how much labor costs have increased per ounce of gold produced:

The DOLLAR image at the bottom of the bars represents the labor cost per ounce, and the GOLD color is the annual price of gold. In 2010, Barrick paid $192 in labor costs per ounce of gold compared to $304 an ounce in 2015. Thus, labor costs per ounce of gold have increased 58% in just five years.
Again, we have to remember, Barrick produced 7.8 Moz of gold in 2010 versus the 6.1 Moz in 2015. So, overall rising labor costs on top of falling economies of scale have put more pressure on Barrick’s bottom line.
What is very interesting about the data in the chart above, for each ounce of gold produced in 2010 (valued at $1,225), it only took $192 of labor costs. However, this increased significantly to $304 for each gold ounce in 2015 (valued at $1,160). Which means, labor costs were only 15.7% of the gold price in 2010 compared to 26.2% in 2015.
Here we can see that more than 25% of the cost to produce gold at Barrick is due to its labor costs alone. It will be interesting to see what this figure will be when Barrick publishes its 2016 Sustainability Report later this year. I would imagine Barrick has continued to lower its overall annual payroll amount, because its gold production declined to 5.5 Moz in 2016 versus 6.1 Moz in 2015. But, the labor cost per ounce will likely increase in 2016.
Regardless, the top gold miners have been hurt considerably due to manipulation of the gold price via the Fed and Central Bank market intervention. I will be publishing a very interesting article next week on how the gold market has been controlled and manipulated since Nixon dropped the Gold-Dollar peg in 1971.
