US stocks ticked up to another record close yesterday (Jan. 8) – the fifth consecutive trading day with a new high, based on the S&P 500 Index. For much of the last two years, in fact, equities been rising steadily and forging new peaks with remarkably low levels of volatility. How long can the calm endure? No one knows, but it’s a safe bet that at some point the market’s tranquility will end. Low-vol regimes aren’t unusual for the stock market, but they come with a limited shelf life. What are the warning signs that will signal regime shift? Let’s consider some possibilities, including a pair of metrics to monitor the trend that may help us decide when the jig is up.
Rising recession risk is an obvious trigger of higher vol and negative returns. The stock market has a history of suffering when the economy stumbles and there’s a near-certain probability of a repeat performance when the next downturn strikes. Accordingly, monitoring the business cycle should be a component of portfolio risk management, although recession risk has been low recently and so it’s unlikely that worries about the macro trend will trigger a market correction in the near term.
It’s worth pointing out, however, that market corrections can and do arrive without recessions and so economic growth is no assurance that stock prices will remain immune to downdrafts. In short, trouble can arise for reasons other than a formal NBER-defined recession.
One potential threat that may or may not be accompanied by a recession in the foreseeable future: changes in monetary policy and inflation, which could send the bulls running for cover. Low interest rates and tame inflation have provided a foundation for rising stock prices in recent years, but the Fed’s gentle but consistent embrace of tighter policy of late could unleash greater market turbulence at some point.
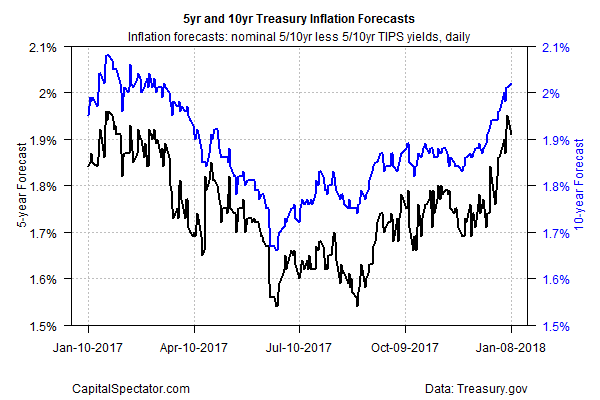
So far, however, modestly higher rates have been a non-event for stocks. Perhaps that’s because inflation has remained below the Fed’s 2.0% target. When and if the inflation trend shows an upward bias, market sentiment could suffer. Note that the Treasury market is predicting that inflation will heat up, if only modestly. For instance, the implied outlook via the yield spread for the 10-year nominal rate less its inflation-indexes counterpart has been above 2% in recent days for the first time since last March. The hard data for consumer prices that’s due on Friday, however, is expected to show the core rate (less food and energy), which the Fed monitors closely, will remain unchanged at a 1.7% year-over-year pace in December, according to Econoday.com’s consensus forecast.

A spike in geopolitical risk – think North Korea – could revive market volatility, although history suggests such bolts from the blue are temporary. In any case, predicting such events is more or less impossible and so there’s not much opportunity for informed analysis on this front.
Whatever the cause of regime shift the tell-tale signs will show up in the market data. That’s obvious, of course, but distinguishing between a temporary bout of higher vol vs. a sustained upward trend is tricky in real time. One way to cut through the noise is looking at two measures of historical volatility.
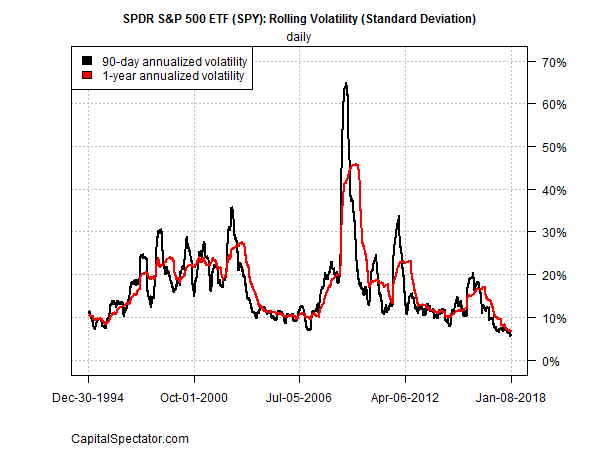
Consider the chart below, which shows the trailing 90-day and one-year annualized standard deviation of daily returns for the US stock market via the SPDR S&P 500 ETF (NYSE:SPY). Short vol has been sliding for two years, all the while remaining well below a long measure. That’s a sign that regime shift isn’t imminent.

But with the absolute level of market volatility plumbing new lows relative to the last several decades, it’s reasonable to wonder if the trend is living on borrowed time. The optimistic view is that the economy has entered a golden period of sustained growth. A degree of support for that forecast can be found in the latest estimate of 2018’s first-quarter GDP growth for the US via Now-casting.com, which estimates a strong 4.6% advance, as of Jan. 5 — well above the macro trend in recent history.
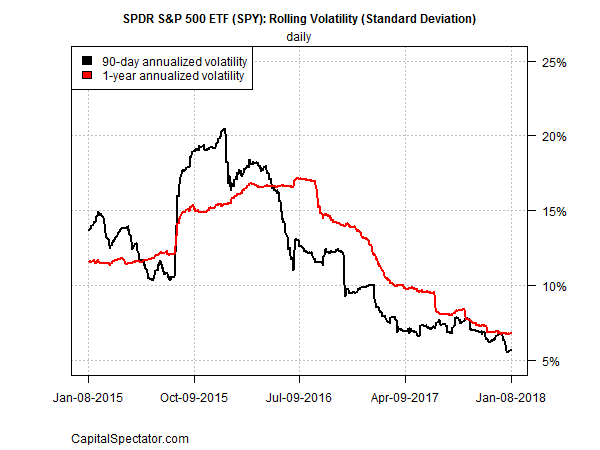
Whenever the low-vol regime finally does turn, how will we know that the shift is more than short-term noise? After all, short vol spikes up from time to time, but recent events have been head fakes. A sustained rise in short vol above its long counterpart will be one clue that the trend may be truly reversing. For some perspective on this point, let’s zoom in on the last three years, as shown in the chart below.

It’s clear that the low-vol regime remains intact. The trailing 90-day standard deviation of SPY’s annualized daily returns is still below its trailing one-year (252 trading days) counterpart.
For now, the party rolls on, supported by an upbeat macro outlook. It’s unclear when the smooth sailing will end. When it does, it’s likely that a continuous rise of 90-day vol above 252-day vol will provide an early warning that a trend shift is underway.
