Get 40% Off
🚨 Volatile Markets? Find Hidden Gems for Serious OutperformanceFind Stocks Now

How High Could Crude Oil Go?

Published 06/29/2017, 11:41 AM
Updated 05/14/2017, 06:45 AM

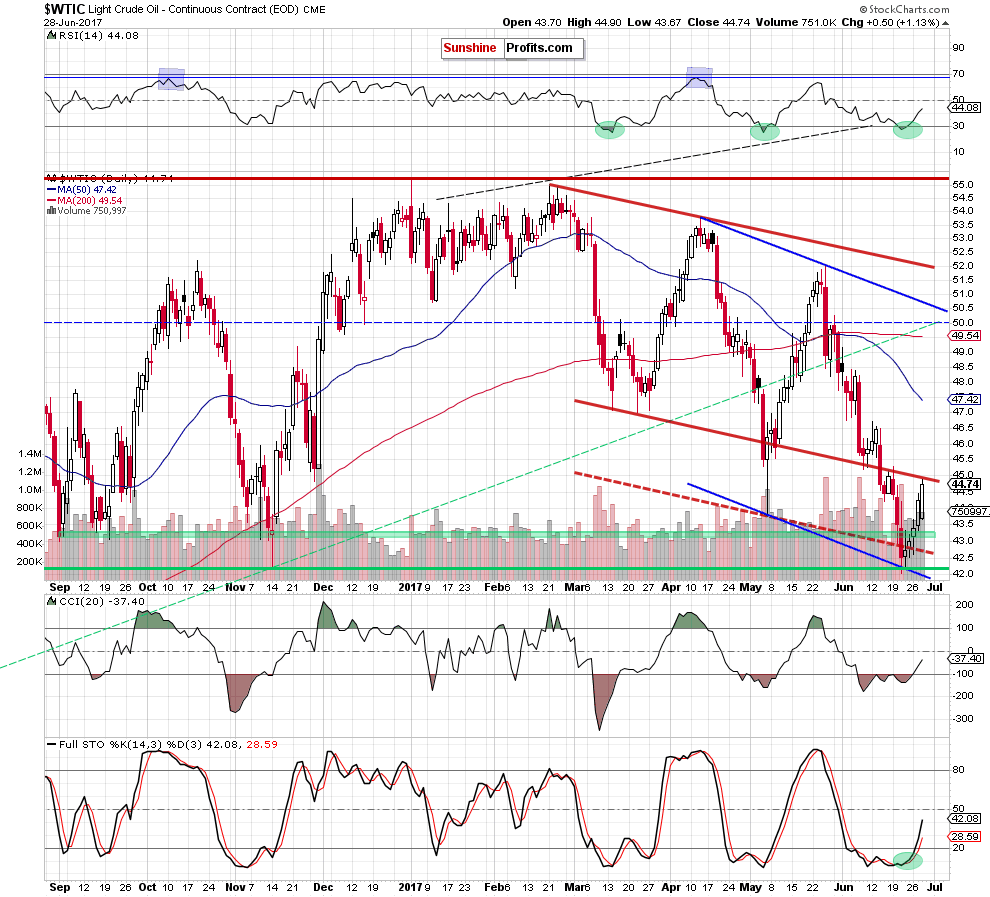
On Wednesday, the black gold gained 1.13% after encouraging the EIA weekly report. As a result, light crude climbed to the previously-broken lower border of the trend channel, but closed the day below it. Will we see further improvement in the coming days?

Although yesterday’s EIA weekly report showed that crude oil inventories rose by 118,000 barrels in the previous week (missing expectations of a draw), the report also showed that gasoline inventories dropped by 894,000 barrels (beating analysts’ forecasts), while distillate stockpiles declined by 223,000 barrels and beat expectations of a rise of 453,000 barrels. The bigger-than-expected drop in gasoline inventories eased worries about a slowdown in demand for refined products, which supported the price of the black gold. As a result, light crude climbed to the previously-broken lower border of the trend channel, but closed the day below it. Will we see further improvement in the coming days?

Crude Oil’s Technical Picture

Let’s take a closer look at the charts and find out.

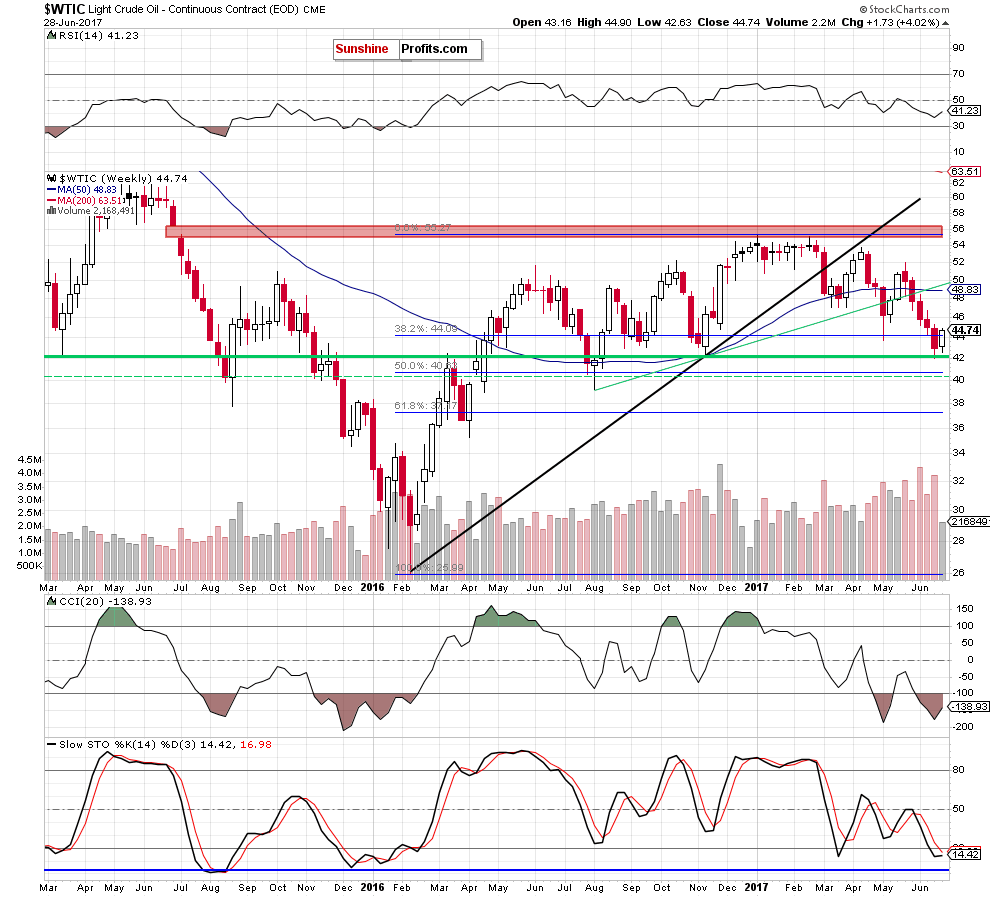
Weekly Crude Oil

Daily Crude Oil

Source: stockcharts.com

Yesterday, we wrote the following:

(…) crude oil extended gains, which resulted in a climb above the previously-broken 38.2% Fibonacci retracement. In this way, the commodity invalidated the earlier breakdown, (…) bounced off the green zone and closed the day above $44.

What’s next for Crude Oil?

Taking into account yesterday’s price action, the buy signals generated by the daily indicators and the medium-term picture, we believe that (…) the first upside target will be around $45, where the previously-broken lower border of the red declining trend channel is.

3rd party Ad. Not an offer or recommendation by Investing.com. See disclosure here or remove ads .

From today’s point of view, we see that crude oil extended gains (making our long positions more profitable), which resulted in a climb to the above-mentioned first upside target. Although this resistance could pause oil bulls, the buy signals generated by the indicators remain in place, supporting further improvement. Additionally, an invalidation of the breakdown under the 38.2% Fibonacci retracement and its positive effect on the price remain in cards, which suggest a climb above $45 in the coming days.

How High Could Crude Oil Go?

If this is the case and we see such price action, the next upside target for oil bulls will be around $46.50-$46.71, where the mid-June highs are. If this resistance is broken, we may see an increase to $48.20-$48.42 (early June highs) or even to the upper border of the blue declining trend channel (currently above the barrier of $50).

Latest comments

I'm not sure I fully understand your support and resistance lines on your charts.  I should post my own. We're broken the short term downward trend, the next battle is understanding where the next resistance level will be...
You need to do more research before publishing an article. In the middle of summer you project an 800K bbl drop as being significant for gasoline. In a good market we would be drawing on gasoline and crude inventories significantly.
Last week you were telling us how low crude was going (below 40). Now we hear you on how high it's going.
@WD, it's a big different. Sigh.
Risk Disclosure: Trading in financial instruments and/or cryptocurrencies involves high risks including the risk of losing some, or all, of your investment amount, and may not be suitable for all investors. Prices of cryptocurrencies are extremely volatile and may be affected by external factors such as financial, regulatory or political events. Trading on margin increases the financial risks.
Before deciding to trade in financial instrument or cryptocurrencies you should be fully informed of the risks and costs associated with trading the financial markets, carefully consider your investment objectives, level of experience, and risk appetite, and seek professional advice where needed.
Fusion Media would like to remind you that the data contained in this website is not necessarily real-time nor accurate. The data and prices on the website are not necessarily provided by any market or exchange, but may be provided by market makers, and so prices may not be accurate and may differ from the actual price at any given market, meaning prices are indicative and not appropriate for trading purposes. Fusion Media and any provider of the data contained in this website will not accept liability for any loss or damage as a result of your trading, or your reliance on the information contained within this website.
It is prohibited to use, store, reproduce, display, modify, transmit or distribute the data contained in this website without the explicit prior written permission of Fusion Media and/or the data provider. All intellectual property rights are reserved by the providers and/or the exchange providing the data contained in this website.
Fusion Media may be compensated by the advertisers that appear on the website, based on your interaction with the advertisements or advertisers.
© 2007-2024 - Fusion Media Limited. All Rights Reserved.