Get 40% Off
🚨 Volatile Markets? Find Hidden Gems for Serious OutperformanceFind Stocks Now

How Far Will Another S&P 500 Upleg Go?

Published 07/30/2020, 10:13 AM
Updated 07/09/2023, 06:31 AM

The good-bye kiss of the line connecting the early June highs indeed meant no farewell at all. The S&P rose in the run-up to the Fed, and extended gains in its aftermath. Are the signs that made me merely cautiously optimistic about the bullish resolution, gone now?

The technical picture certainly cleared up with the credit markets moving higher and technology not having a really bad day either. Will its consolidation make it through the earnings report batch later today? Semiconductors hint at a rather constructive outcome, and my sectoral observations yesterday remain true also today:

"(…) Technology is holding up, semiconductors aren't weakening relatively to the sector, and the rotation into healthcare, materials, and industrials is very much on. The defensives (utilities and consumer staples) are also improving their posture. Consumer discretionaries are firm, and financials are getting better relative to the index."

Let's check the other building blocks in the outlook assessment.

S&P 500 In The Short-Run

I’ll start with the daily chart perspective (charts courtesy of http://stockcharts.com ):
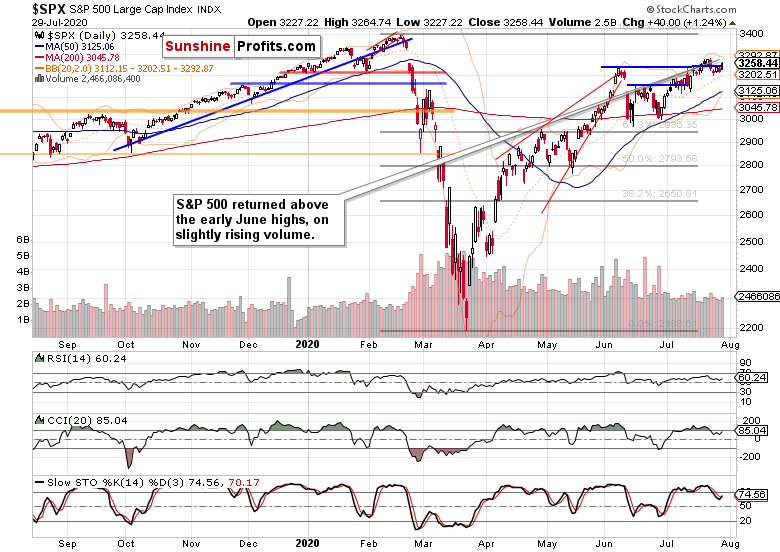
Yesterday's close above the early June highs on rising volume is a bullish turn of events as stocks continue their chop around the horizontal blue line. The Fed didn't really surprise yesterday, and stocks liked the message of continued support—in line with the dynamic I mentioned yesterday:

"(…) Regardless of the real action in precious metals (canary in the coal mine), the Fed would err on the side of not fighting inflation too soon. And thus far fighting the deflationary corona effects, the stimulus is winning and being embraced with open arms by stocks."

3rd party Ad. Not an offer or recommendation by Investing.com. See disclosure here or remove ads .

So, I think that the bears would be getting ahead of themselves expecting a lasting downturn right now—I treat the consolidation as one with a higher likelihood of a bullish resolution than a bearish one.

Today's frightening advance Q2 GDP and poor unemployment data are likely to be brushed aside during the regular session's trading—I see the focus as being rather on the upcoming stimulus details and tech earnings.

Let's check the credit market performance.

The Credit Markets’ Point Of View

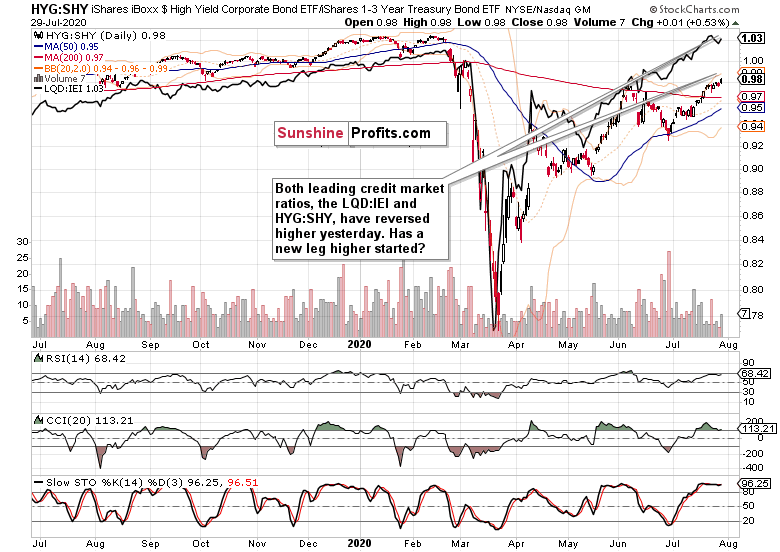
High yield corporate bonds (HYG ETF) regained ground yesterday, and on promising volume (please see this and many more charts at my home site). The Fed didn't disappoint, and the sideways consolidation has indeed been resolved with an upswing. The move higher is confirmed by rising investment grade corporate bonds (LQD ETF). The pre-Fed gyrations appear to be over, and with the settling dust, I look for a renewed uptrend.
High Yield Corporate Bonds

Both the leading credit market ratios—high yield corporate bonds to short-term Treasuries (HYG:SHY) and investment grade corporate bonds to longer-dated Treasuries (LQD:IEI)—are moving in lockstep again. The short-term weakness is about to give way to another advance in my opinion.
HY Corporate Bonds Vs Short-Dated Treasuries

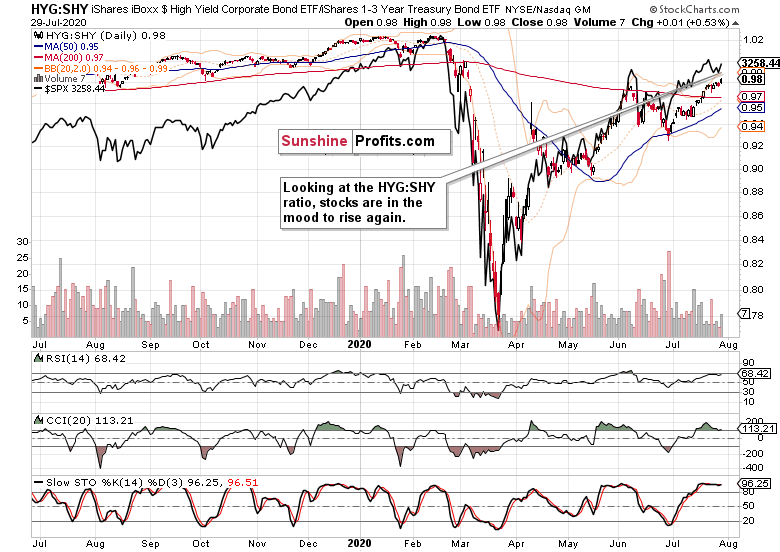
The overlaid S&P 500 closing prices (black line) reveal the extent of stocks taking the cue from the HYG:SHY ratio. The 500-strong index is recovering from its recent soft patch, and is ready to extend gains in case HYG:SHY moves up again. And the ratio's upcoming rise isn't a far-fetched idea. The similarity to its early July chop is again being resolved with an upswing.

3rd party Ad. Not an offer or recommendation by Investing.com. See disclosure here or remove ads .

Smallcaps, Emerging Markets AndS&P 500 Market Breadth

The Russell 2000 (IWM ETF) is trading with solidly bullish undertones. Yesterday's rising volume brought its closing prices farther away from the 200-day moving average, and smallcaps continue trading closer to their early July highs than the S&P 500. Such a very short-term outperformance can turn into more than a few days' affair, benefitting the stock bulls broadly.

Mirroring the technology consolidation in a way, the emerging markets (EEM ETF) aren't going pretty much anywhere. The fact that they aren't selling off though, points to a floor below stock prices these days.
CBOE Volatility Index

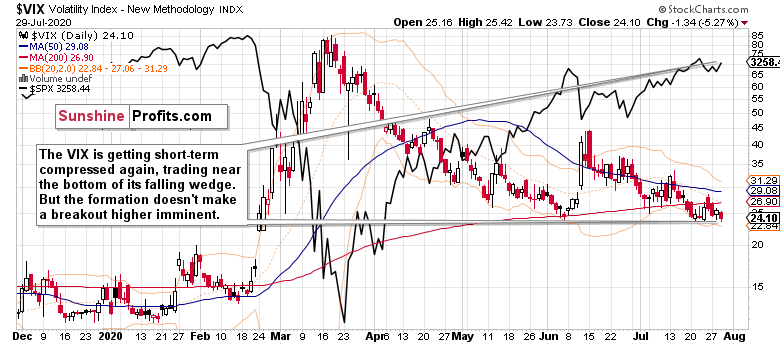
Volatility $VIX has moved to the lower border of its falling wedge, and doesn't scream that an upside breakout is knocking on the door. As a result, it won't likely influence the prevailing direction in stocks much. And that points to the S&P 500 upswing continuation.

Summary

Summing up, yesterday's S&P 500 rebound rekindled the bullish spirits, and the credit market posture coupled with market breadth improvements (both the advance-decline line and advance-decline volume are encouraging) reflect that precisely. Expecting the stimulus details, stocks are likely to shake off yesterday-mentioned fundamental risks and leave the effects of stalling job market and horrific GDP decline in the rear view mirror. With the Fed perceived as having the markets' back, the path of least resistance still remains chiefly higher. Today's tech heavyweights' earnings will be THE bellwether speaking with a decisive tone, and I keep being cautiously optimistic.

Latest comments

I wonder that with GDP shrinking and Americans waiting for another stimulus while doing nothing , the writer still has a courage to see S&P rising. The printing press is tired of printing $s and America is losing its morals to lead the world as Trump is calling for delaying elections and doubts on credibility as well. I wonder once sensible Americans can afford such chaos ?
How u know our internal? Via tv, news, internet?
Lol u crazy man. Stop watching CNN
Well, I look at the charts, and at the U.S. open on Thursday, I was still not writing off the bullish case. The market has indeed risen in the face of data unthinkable mere quarters ago - it's the market reaction that counts here.
It may go back to all time high.
Before that, the February bearish gap on the daily chart must first be closed
I bought puts today at dead low.
Excellent job, now buy calls tomorrow at the top
Monica if the market crashes in september, how low do you think the spy could drop?
Let's see first how the index performs before that, and the number and extent of the cracks in the stock bulls' dam at that time
The only real bullish scenario are the raising C19 data and this will hurt dramstically as GDP showed likewise. Even FANG numbers compared to last year number clearly show that QE is not a selffulfilling issue and stock prises are overdue to correct to fudamentals. Even FED annonced it ...
big tech killed it today on earnings. it's going to go up up up from here
I understand Unoqueva Alguno comment better now, because I have noticed the changed title of my article here. In its intended original, it reads "How Far Is Another S&P 500 Upleg?". Check SP - I don't know why it's different here...
Yet again, your analysis was spot on. Thanks for sharing and doing what you do. Great work!
 Thank you very much. This is the way I am - I don't want anyone to be misled by such a title leading astray.
 Thank you very much, take care!
Congratulations. This article is c on the comparable to those articles that pushed investors to buy sock in 2000 or 2008.
I am sorry, what does it mean "This article is c on the comparable to..." More signs are still pointing to a bullish resolution, and downside risk in a long position can be taken care of using a reasonably placed stop-loss, which is what I do
HYG/SHY touched the high from June and has now retreated, but getting to that zone and taking some time to break though is normal market activity. Even today on a fairly good market pullback, that ratio still is holding just under this important resistance level.  ViX took a spike as expected and I mentioned yesterday it was likely due.  It's following it's wedge and its support levels quite accurately.  There is a HS type technical pattern on the ES with a neckline at 3190. I expect this holds.  The trading pattern this week has mimicked the last quarters week of big tech reporting almost exactly.  I expect a stimulus announcement plus a continued bull run end of the week or early next week.
Thank you. Indeed the credit markets aren't yielding, and remain bullishly positioned. The bullish resolution in stocks remains the more likely scenario.
Besides, have you noticed how well IWM had been holding up earlier in today's session vs. SPY?
This market is hilarious. We just printed the worst quarterly GDP numbers on record, jobless claims ticking up, real unemployment is still above 10%, and PE ratios suggest an overvalued market. I don't disagree with your technical analysis but at some point fundamentals need to be considered.
 I've positioned my idea of that day when fundamentals count for more, as closer to the elections - so, my timing is in line with your idea and the emphasis (summary) of today's article
 I don't think Fed actions/announcements are enough to keep pushing the markets higher at these levels. IMO, we need positive news on a stimulus package and big tech needs to have strong showings across the board with earnings after the bell today. I think the bullishness in the markets is more fragile than it seems, and downside risk is not adequately priced in.
Fundamentals never have to be considered really. Everyone forgets a stock is not a tangible asset. It’s only worth what people are willing to pay. That’s why companies with great sales, cashflow and profits can be worth less than companies with lower amounts of all the above. Some IPO’s should be offered for free or negative even if fundamentals “had” to mean something.
Risk Disclosure: Trading in financial instruments and/or cryptocurrencies involves high risks including the risk of losing some, or all, of your investment amount, and may not be suitable for all investors. Prices of cryptocurrencies are extremely volatile and may be affected by external factors such as financial, regulatory or political events. Trading on margin increases the financial risks.
Before deciding to trade in financial instrument or cryptocurrencies you should be fully informed of the risks and costs associated with trading the financial markets, carefully consider your investment objectives, level of experience, and risk appetite, and seek professional advice where needed.
Fusion Media would like to remind you that the data contained in this website is not necessarily real-time nor accurate. The data and prices on the website are not necessarily provided by any market or exchange, but may be provided by market makers, and so prices may not be accurate and may differ from the actual price at any given market, meaning prices are indicative and not appropriate for trading purposes. Fusion Media and any provider of the data contained in this website will not accept liability for any loss or damage as a result of your trading, or your reliance on the information contained within this website.
It is prohibited to use, store, reproduce, display, modify, transmit or distribute the data contained in this website without the explicit prior written permission of Fusion Media and/or the data provider. All intellectual property rights are reserved by the providers and/or the exchange providing the data contained in this website.
Fusion Media may be compensated by the advertisers that appear on the website, based on your interaction with the advertisements or advertisers.
© 2007-2024 - Fusion Media Limited. All Rights Reserved.