
Raise the dollar, drop the metals. Under most possible scenarios, things don’t look good for gold silver, and mining stocks – for the medium-term.
With the USD Index and U.S. Treasury yields the main fundamental drivers of the precious metals' performance, some confusion has arisen due to their parallel and divergent moves. For example, sometimes the USD Index rises while U.S. Treasury yields fall, or vice-versa, and sometimes the pair move higher/lower in unison. However, it’s important to remember that different economic environments have different impacts on the USD Index and U.S. Treasury yields.
To explain, the USD Index benefits from both the safe-haven bid (stock market volatility) and economic outperformance relative to its FX peers. Conversely, U.S. Treasury yields only benefit from the latter. Thus, when economic risks intensify (like what we witnessed with Evergrande on Sept. 20), the USD Index often rallies, while U.S. Treasury yields often fall. Thus, the economic climate is often the fundamental determinant of the pairs’ future paths.
For context, I wrote on April16:
The precious metals suffer during three of four possible scenarios:
- When the bond market and the stock market price in risk, it’s bearish for the precious metals
- When the bond market and the stock market don’t price in risk, it’s bearish for the precious metals
- When the bond market doesn’t price in risk, but the stock market does, it’s bearish for the precious metals
- When the bond market prices in risk and the stock market doesn’t, it’s bullish for the precious metals
Regarding scenario #1, when the bond market and the stock market price in risk (economic stress), the USD Index often rallies and its strong negative correlation with the precious metals upends their performance.
Regarding scenario #2, when the bond market and the stock market don’t price in risk, U.S. economic strength supports a stronger U.S. dollar and rising U.S, Treasury yields reduce the fundamental attractiveness of gold.
For context, precious metals are non-yielding assets, and when interest rates rise, bonds become more attractive relative to gold (for some investors).
Regarding scenario #3, when the stock market suffers and U.S. Treasury yields are indifferent, the usual uptick in the USD Index is a bearish development for precious metals (for the same reasons outlined in scenario #1).
Regarding scenario #4, when the bond market prices in risk (lower yields) and the stock market doesn’t, inflation-adjusted (real) interest rates often decline, and risk-on sentiment can hurt the USD Index. As a result, the cocktail often uplifts precious metals due to lower real interest rates and a weaker U.S. dollar.
The bottom line?
The USD Index and U.S. Treasury yields can move in the same direction or forge different paths. However, while a stock market crash is likely the most bearish fundamental outcome that could confront precious metals, Scenario #2 is next in line. While it may (or may not) seem counterintuitive, a strong U.S. economy is bearish for precious metals. When U.S. economic strength provides a fundamental thesis for both the USD Index and U.S. Treasury yields to rise (along with real interest rates), the double-edged sword often leaves gold and silver with deep lacerations.
In the meantime, though, with investors eagerly awaiting the Fed’s monetary policy decision today, QE is already dying a slow death. Case in point: not only has the USD Index recaptured 93 and surged above the neckline of its inverse (bullish) head-and-shoulders pattern, but the greenback’s fundamentals remain robust. With 78 counterparties draining more than $1.240 trillion out of the U.S. financial system on Sept. 21, the Fed’s daily reverse repurchase agreements hit another all-time high.
Please see below:
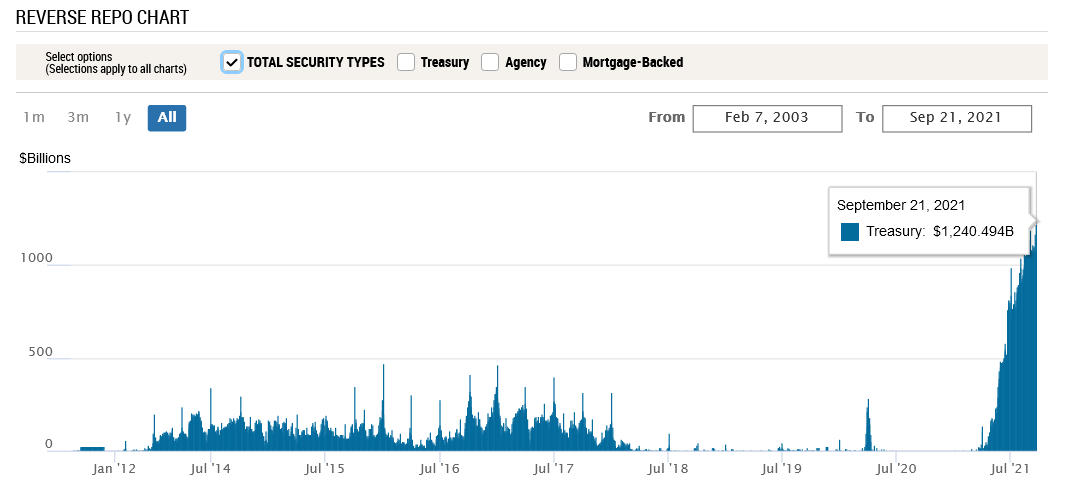
Source: New York Fed
To explain, a reverse repurchase agreement (repo) occurs when an institution off loads cash to the Fed in exchange for a Treasury security (on an overnight or short-term basis). And with U.S. financial institutions currently flooded with excess liquidity, they’re shipping cash to the Fed at an alarming rate. And while I’ve been warning for months that the activity is the fundamental equivalent of a taper – due to the lower supply of U.S. dollars (which is bullish for the USD Index) – the psychological effect is not the same. However, as we await a formal taper announcement from the Fed, the U.S. dollar’s fundamental foundation remains quite strong.
Furthermore, with the Wall Street Journal publishing a rather cryptic article on Sept. 10 titled “Fed Officials Prepare for November Reduction in Bond Buying,” messaging from the central bank’s unofficial mouthpiece implies that something is brewing. And while the Delta variant and Evergrande provide the Fed with an excuse to elongate its taper timeline, surging inflation has the Fed increasingly handcuffed.
As a result, Goldman Sachs Chief U.S. Economist David Mericle expects the Fed to provide “advance notice” today and set the stage for an official taper announcement in November. He wrote:
“While the start date now appears set, the pace of tapering is an open question. Our standing forecast is that the FOMC will taper at a pace of $15 billion per meeting, split between $10 billion in UST and $5 billion in MBS, ending in September 2022. But a number of FOMC participants have called instead for a faster pace that would end by mid-2022, and we now see $15 billion per meeting vs. $15 billion per month as a close call.”
On top of that, with stagflation bubbling beneath the surface, another hawkish shift could materialize.
To explain, I wrote on Jun. 17:
On April 30, I warned that Jerome Powell, chairman of the U.S. Federal Reserve, was materially behind the inflation curve.
I wrote:
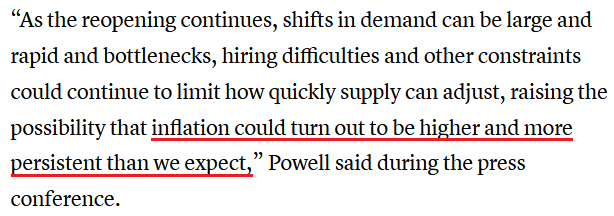
With Powell changing his tune from not seeing any “unwelcome” inflation on Jan. 14 to “we are likely to see upward pressure on prices, but [it] will be temporary” on April 28, can you guess where this story is headed next?
And with the Fed chair revealing on June 16 what many of us already knew, he conceded:
Source: CNBC
Moreover, while Powell added that “our expectation is these high inflation readings now will abate,” he also conceded that “you can think of this meeting that we had as the ‘talking about talking about’ [tapering] meeting, if you’d like.”
However, because actions speak louder than words, notice the monumental shift below?
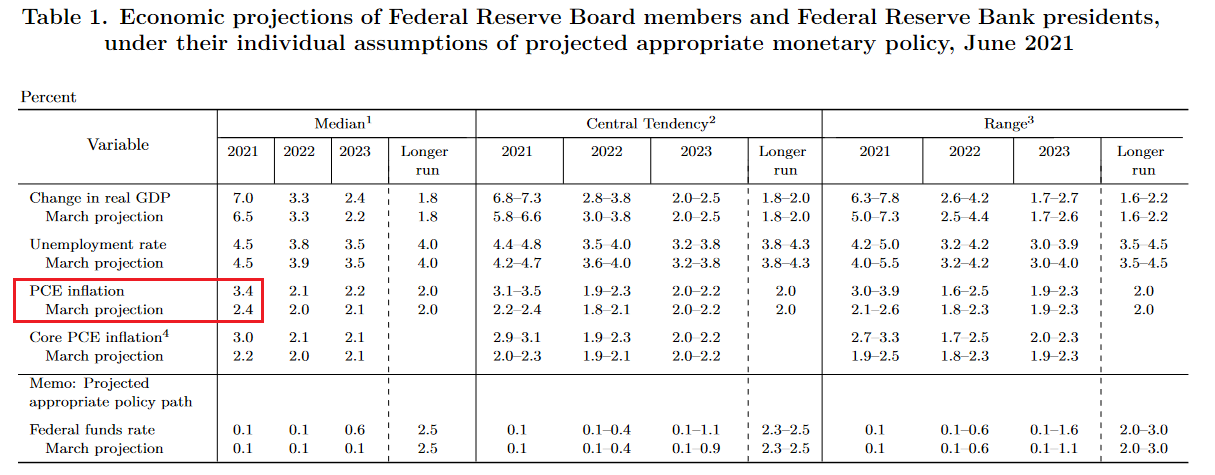
Source: U.S. Fed
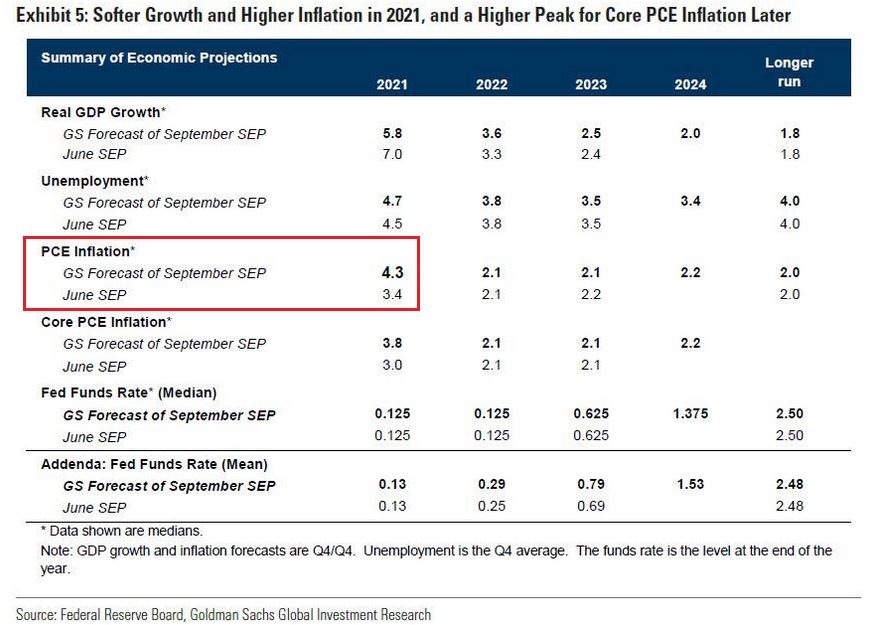
To explain, if you analyze the red box, you can see that the Fed increased its 2021 Personal Consumption Expenditures (PCE) Index projection from a 2.4% year-over-year (YoY) rise to a 3.4% YoY rise. But even more revealing, the original projection was made only three months ago. Thus, the about face screams of inflationary anxiety.
What’s more, I highlighted on Aug. 5 that the hawkish upward revision increased investors’ fears of a faster rate-hike cycle and contributed to the rise in the USD Index and the fall in the GDXJ ETF (our short position).
Please see below:
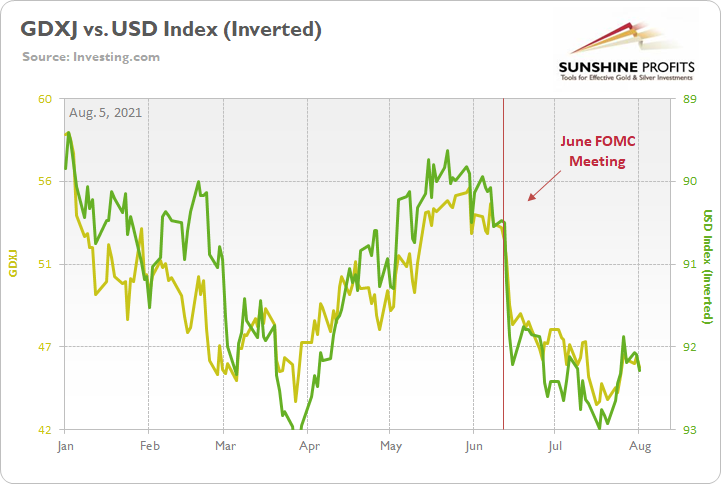
And why is all of this so important? Well, with Mericle expecting the Fed to increase its 2021 PCE Index projection from 3.4% to 4.3% today (the red box below), if the Fed’s message shifts from we’re adamant that inflation is “transitory” to “suddenly, we’re not so sure,” a re-enactment of the June FOMC meeting could uplift the USD Index and upend precious metals once again. For context, the FOMC’s July meeting did not include a summary of its economic projections and today’s ‘dot plot’ will provide the most important clues.
Please see below:
Finally, with CNBC proclaiming on Sept. 21 that the Fed is “widely expected to indicate it is getting ready to announce it will start paring back its $120 billion in monthly purchases of Treasuries and mortgage-backed securities,” even the financial media expects some form of “advance notice.”
Source: CNBC
The bottom line?
While the Delta variant and Evergrande have provided the Fed with dovish cover, neither addresses the underlying problem. With inflation surging and the Fed’s 2% annual target looking more and more like wishful thinking, reducing its bond-buying program, increasing the value of the U.S. dollar, and decreasing commodity prices is the only way to get inflation under control. In absence, the Producer Price Index (PPI) will likely continue its upward momentum and the cost-push inflationary spiral will likely continue as well.
In conclusion, the gold miners underperformed gold once again on Sept. 21 and the relative weakness is profoundly bearish. Moreover, while the USD Index was roughly flat, Treasury yields rallied across the curve. And while Powell will do his best to thread the dovish needle today, he’s stuck between a rock and a hard place: if he talks down the U.S. dollar (like he normally does), commodity prices will likely rise, and inflation will likely remain elevated. If he acknowledges reality and prioritizes controlling inflation, the U.S. dollar will likely surge, and the general stock market should suffer. As a result, with the conundrum poised to come to a head over the next few months (maybe even today), precious metals are caught in the crossfire and lower lows will likely materialize over the medium term.