Historical Perspective
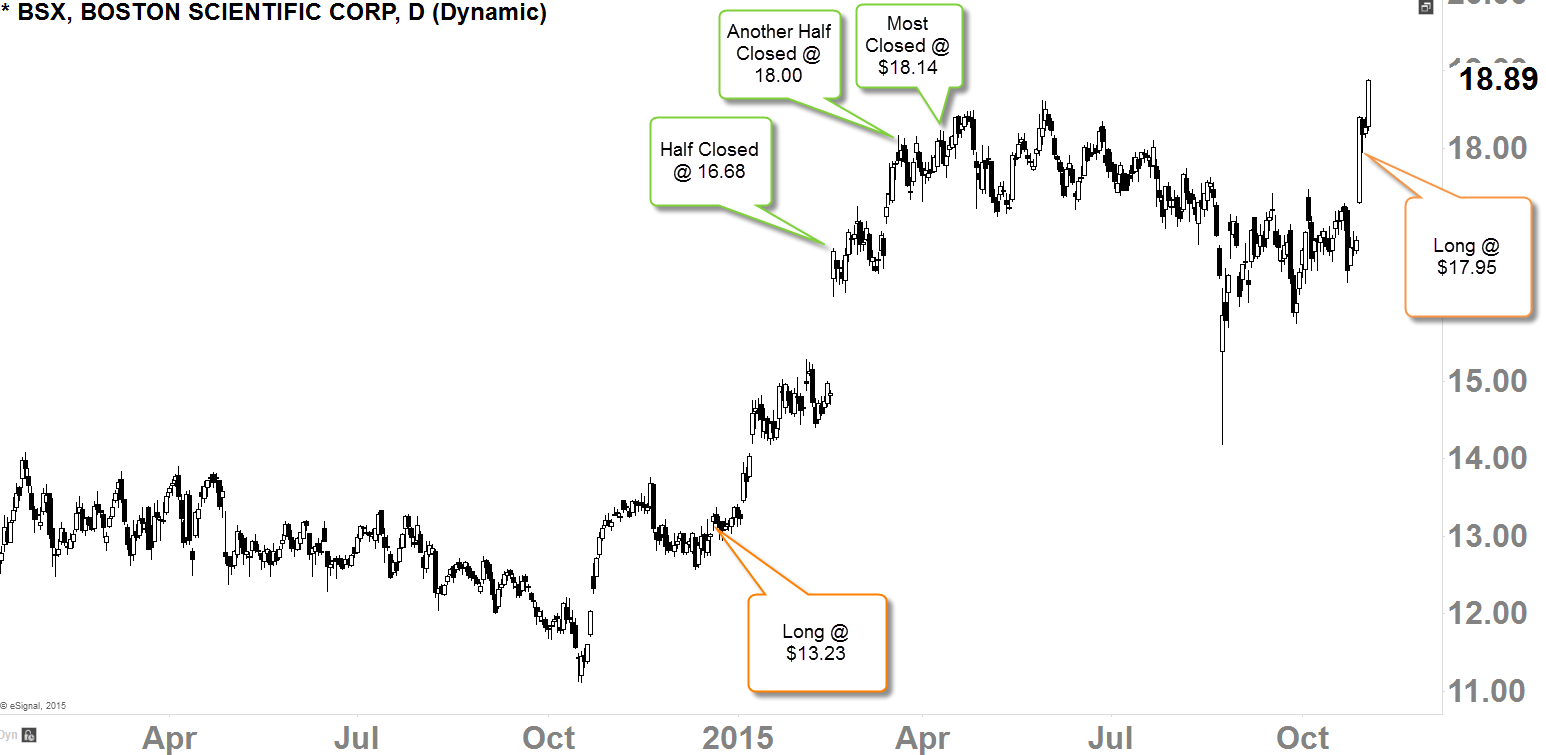
Since late-2014, we've been involved with Boston Scientific (N:BSX) as one of our long-term strategy positions.
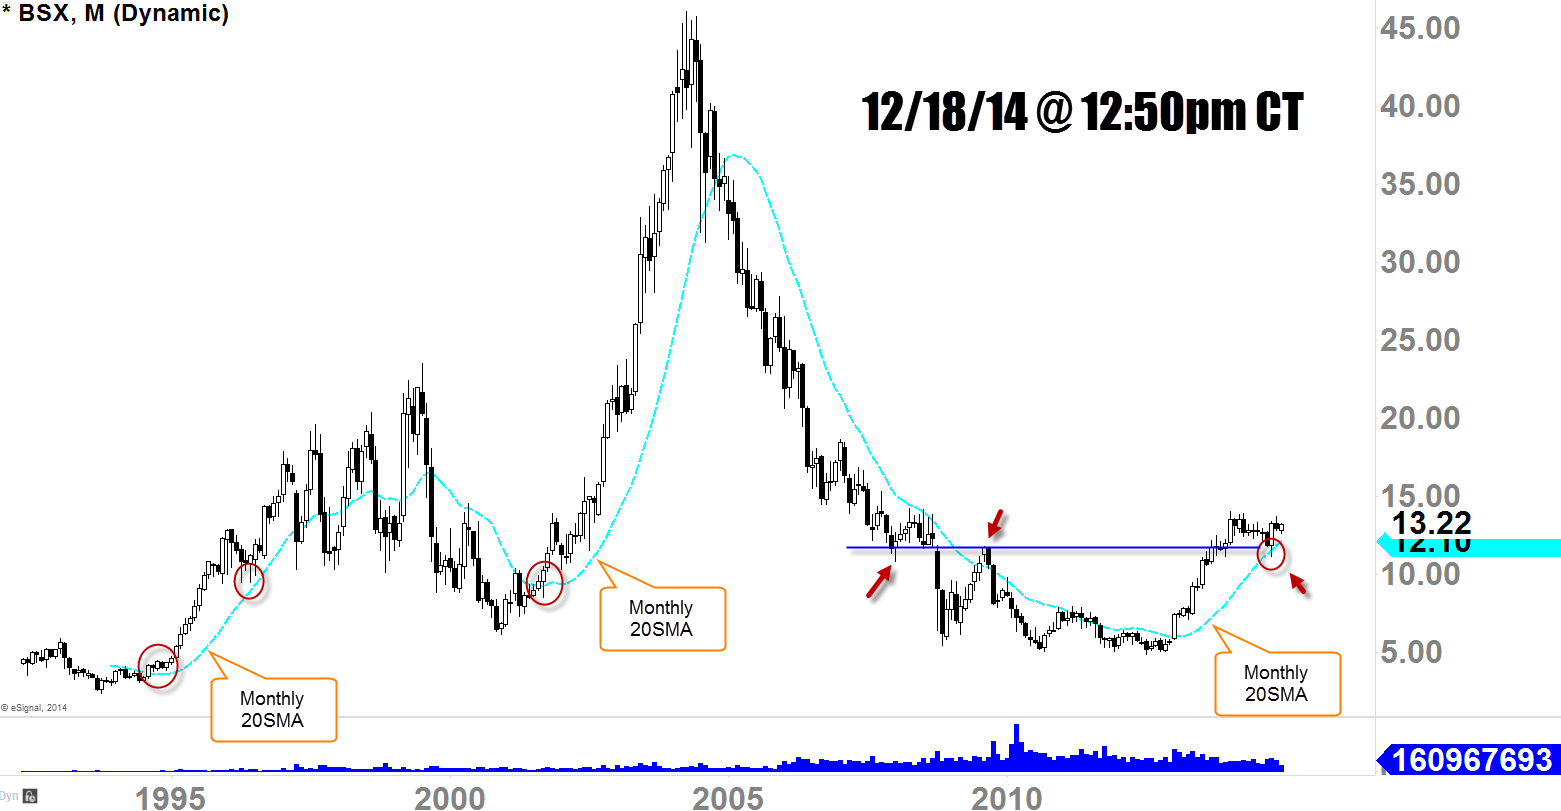
As you can see the chart from the late-2014, Boston Scientific was attempting to cultivate uptrend (since the 2005-crash) as it was holding above the recent pivot (see arrows) at around $12ish. At this time, we've concluded, that there is a good probability which the price-action could continue to resume to the upside to establish that uptrend with our next target price of $18ish (this was when the stock was trading at early-13's in early-2012).
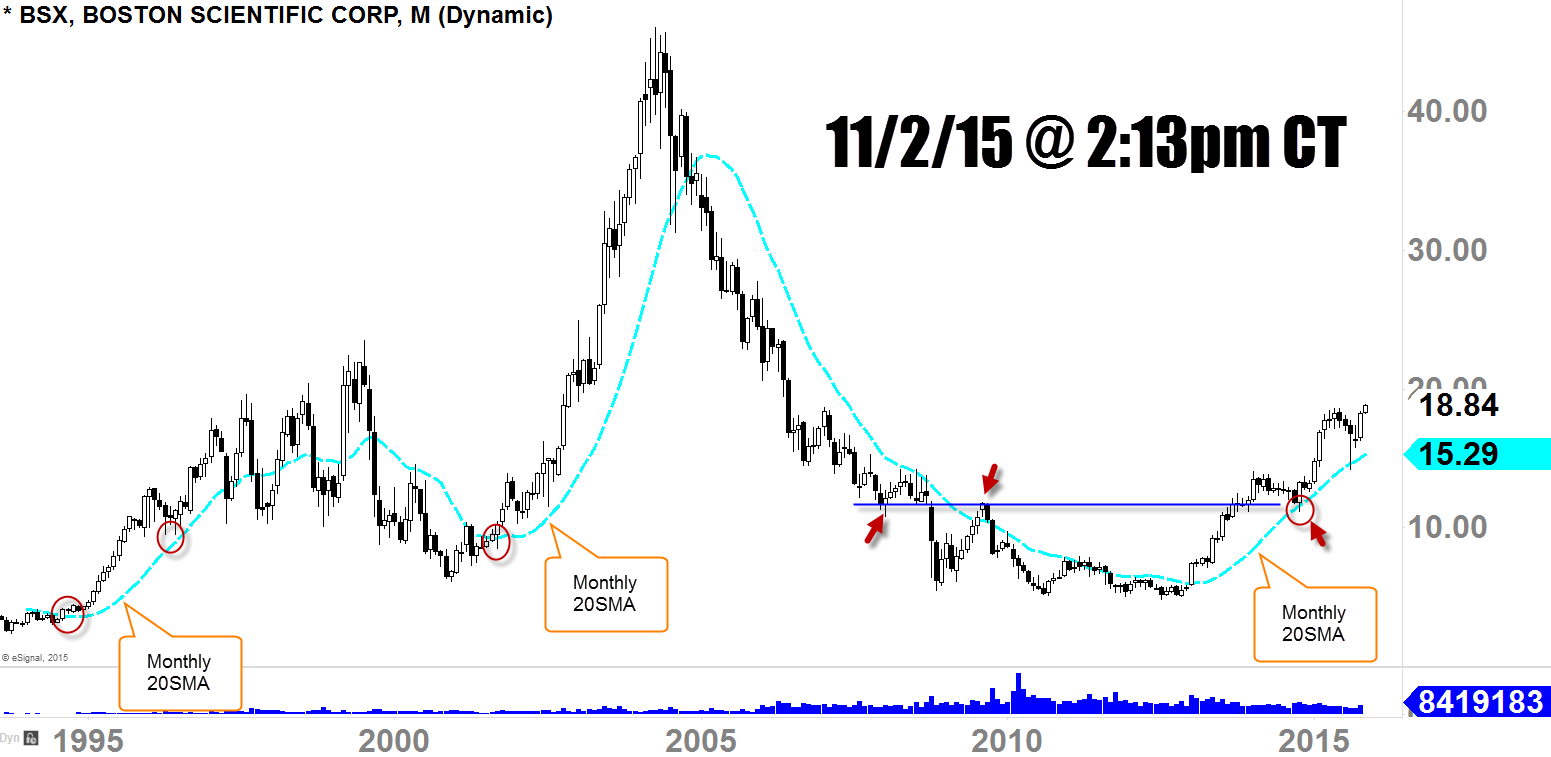
Price pulled back after hitting the $18-level (May of 2015) to retest the monthly-20SMA as I have annotated in the charts below. In late-August, we saw a sharp decline, but just a few months later (today), stock bounced back up resuming to it's primary-term uptrend.
- With a well-established "higher-lows and higher-highs" in this monthly-chart, trend is healthy looking at things in a big picture
Primary-Term Uptrend
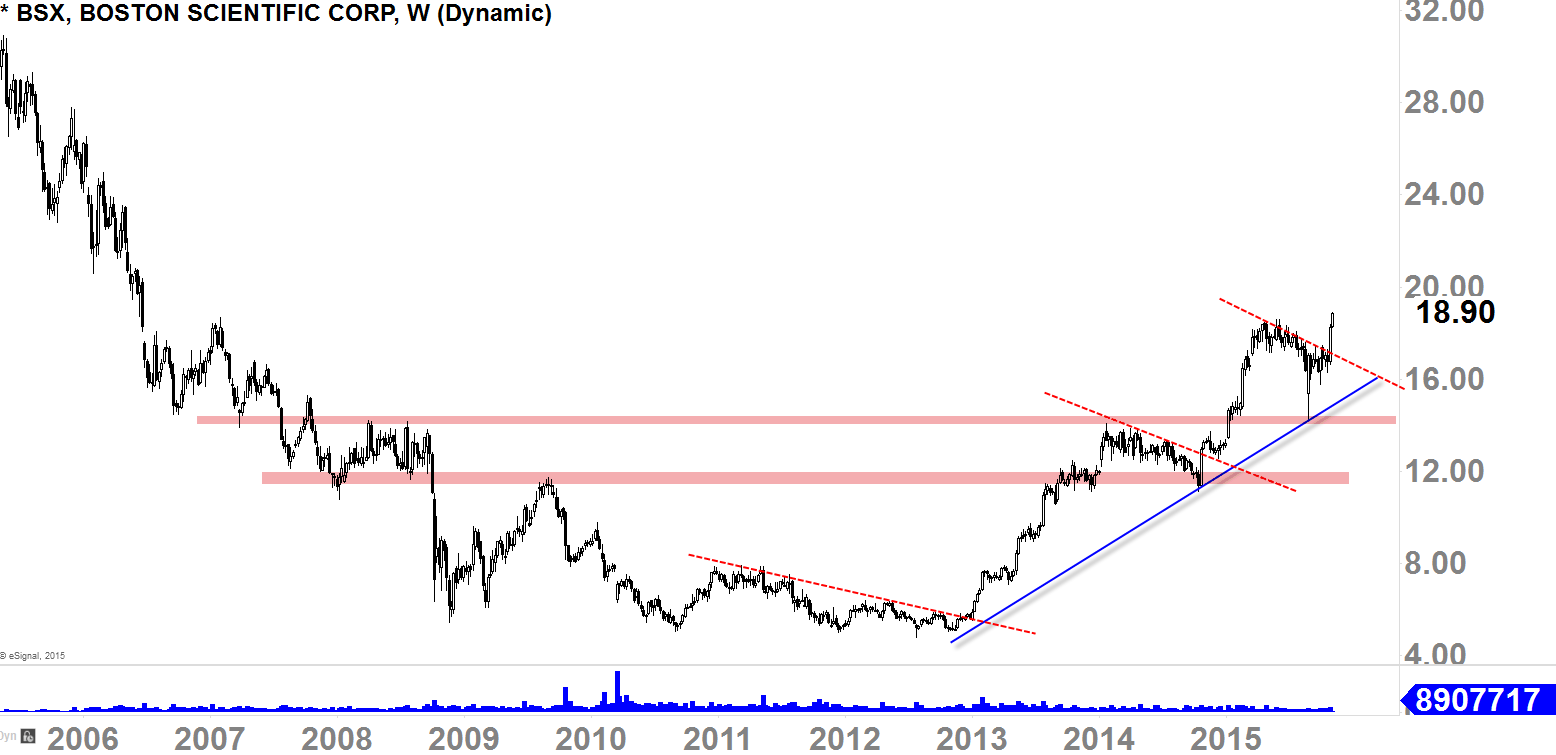
Boston Scientific loves to rest in a "falling consolidation" formation before resuming back up as you can see in the chart below.
We would get a good bullish-move higher, and then the buyers will rest by pulling back to the old-resistance level to test as new-support; if the retest is successfully exceeded, that's what we call a "HIGHER LOW" which means the uptrend (cultivation of higher-lows and higher-highs) is still valid.
"Trend is assumed to be in effect until it gives us clear signal(s) that it has been reversed". - Charles Dow. Looks like we will have another swift bullish move to the upside looking at this primary-term-uptrend perspective as we are now well-above the resistance-level (red dotted) with healthy cultivation of an uptrend.
- This stock is now starting to cultivate strong bullish-uptrend, which that could last for years as long as the cultivation continues with well-established "HIGHER LOWS" and "HIGHER HIGHS".
Our Holdings
After positive ER reaction just several trading-sessions ago, the stock soared confirming that bounce, also confirming the breakout from that "falling consolidation" formation we've been in for about 7-months. Currently, the stock is making new highs trading at $18.87ish, this is a good sign for the buyers confirming the price-action print for the cultivation of the 'HIGHER HIGH".
- We've decided to go back long on this stock at $17.95ish last week for the next target price of $23.00ish


