
Host Hotels & Resorts, Inc. (NYSE:HST) reported second-quarter 2017 adjusted funds from operations ("FFO") of 49 cents per share, beating the Zacks Consensus Estimate of 46 cents. Adjusted FFO per share also matched the year-ago tally.
Results reflect growth in comparable hotel revenue per available room (RevPAR) and improvement in margin. The company also raised its full-year 2017 outlook.
The company posted total revenue of nearly $1.44 billion, which surpassed the Zacks Consensus Estimate of $1.43 billion. However, the figure was down 1.2% from the prior-year number, as a result of revenue loss from sale of 12 hotels in 2016 and 2017.
Host Hotels & Resorts, Inc. Price, Consensus and EPS Surprise
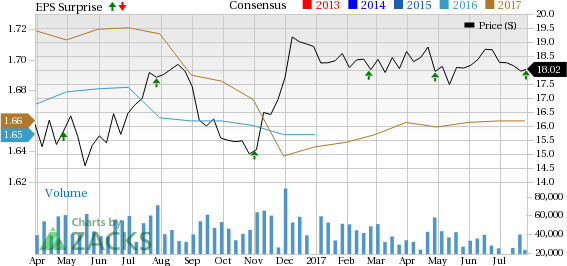
Host Hotels & Resorts, Inc. Price, Consensus and EPS Surprise | Host Hotels & Resorts, Inc. Quote
Note: The EPS numbers presented in the above chart represent funds from operations (“FFO”) per share.
Quarter in Details
During the reported quarter, comparable hotel revenues remained nearly flat year over year at $1.3 billion. Although, the company witnessed improvements in RevPAR, it was marred by a decline in food and beverage revenues.
Comparable RevPAR (on a constant dollar basis) was up 1.7% year over year, driven by a 0.8% increase in average room rate and 70 basis points (bps) expansion in occupancy to 83.2%. At its domestic properties, comparable hotel RevPAR inched up 1.8%. However, the same at its comparable international properties was down 3.1% on a constant-dollar basis.
Nevertheless, improvements in RevPAR aided GAAP operating profit margin growth of 50 bps for the quarter.
During the quarter under review, the company invested around $16 million for redevelopment, and return on investment (ROI) capital expenditures. It also deployed approximately $47 million on renewal and replacement capital expenditures.
In the second quarter, the company accomplished the sale of the Sheraton Memphis Downtown for $67 million, recording a gain of around $28 million.
Finally, the company exited second-quarter 2017 with around $644 million of unrestricted cash and $775 million of available capacity remaining under the revolver part of its credit facility. Moreover, as of Jun 30, 2017, total debt was $4.0 billion, having an average maturity of 5.5 years and an average interest rate of 3.9%. Notably, the company did not buy back any shares in 2017. It has $500 million of capacity available under its current repurchase program.
Outlook
Host Hotels raised its outlook for full-year 2017. The company now expects adjusted FFO per share in the range of $1.64–$1.68 compared to the prior guidance of $1.60–$1.68. The Zacks Consensus Estimate for the same is currently pegged at $1.66.
This is backed by comparable hotel RevPAR (constant U.S. dollar basis) growth expectations of 1.00–1.75%, against the prior outlook of 0.0–2.0%.
In Conclusion
We are encouraged with the better-than-expected performance of Host Hotels in the second quarter. The company’s solid portfolio of upscale hotels across lucrative markets, strategic capital-recycling program and a healthy balance sheet bode well for long-term growth. However, supply growth, specifically in the company’s key markets, remains a concern. In addition, dilutive impact of asset sales cannot be bypassed. Also, rate hike add to its woes.
Host Hotels currently has a Zacks Rank #3 (Hold). You can see the complete list of today’s Zacks #1 Rank (Strong Buy) stocks here.
The stock has declined 4.3% year to date, underperforming the 3.8% gain of the industry it belongs to.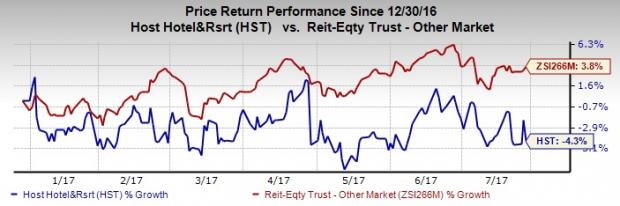
Let us now look forward to the earnings releases of AvalonBay Communities, Inc. (NYSE:AVB) , Alexandria Real Estate Equities, Inc. (NYSE:ARE) and Extra Space Storage Inc. (NYSE:EXR) , all of which are expected to report quarterly figures in the next week.
Note: FFO, a widely used metric to gauge the performance of REITs, is obtained after adding depreciation and amortization and other non-cash expenses to net income.
More Stock News: Tech Opportunity Worth $386 Billion in 2017
From driverless cars to artificial intelligence, we've seen an unsurpassed growth of high-tech products in recent months. Yesterday's science-fiction is becoming today's reality. Despite all the innovation, there is a single component no tech company can survive without. Demand for this critical device will reach $387 billion this year alone, and it's likely to grow even faster in the future.
Zacks has released a brand-new Special Report to help you take advantage of this exciting investment opportunity. Most importantly, it reveals 4 stocks with massive profit potential. See these stocks now>>
AvalonBay Communities, Inc. (AVB): Free Stock Analysis Report
Host Hotels & Resorts, Inc. (HST): Free Stock Analysis Report
Extra Space Storage Inc (EXR): Free Stock Analysis Report
Alexandria Real Estate Equities, Inc. (ARE): Free Stock Analysis Report
Original post
Zacks Investment Research