
The Home Depot, Inc. (NYSE:HD) has posted fourth-quarter fiscal 2019, wherein earnings and sales beat the Zacks Consensus Estimate. However, the company’s top line declined on a year-over-year basis, while earnings improved. It also provided a solid view for fiscal 2020.
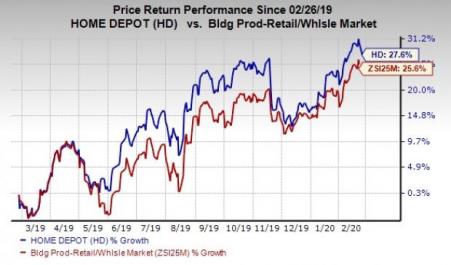
Shares of the home-improvement retailer rose 2.6% in the pre-market session, following the better-than-expected top and bottom-line results. Moreover, the Zacks Rank #3 (Hold) stock has rallied 27.6% in the past year, outpacing the industry’s growth of 25.6%.
Q4 Highlights
Earnings of $2.28 per share grew 9.1% from $2.09 registered in the year-ago quarter. The bottom line also surpassed the Zacks Consensus Estimate of $2.10. Results were partly offset by an extra week of operation in the fourth quarter of fiscal 2018 compared with the reported quarter, which added 21 cents to earnings per share in the fourth quarter of fiscal 2018.
The Home Depot, Inc. Price, Consensus and EPS Surprise
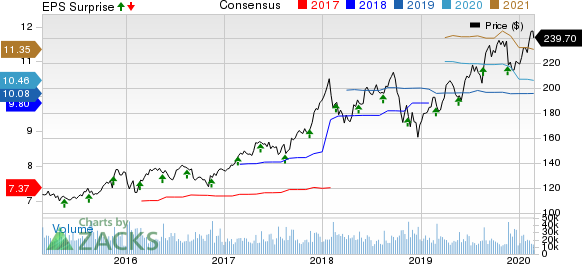
The Home Depot, Inc. price-consensus-eps-surprise-chart | The Home Depot, Inc. Quote
Net sales declined 2.7% to $25,782 million from $26,491 million in the year-ago quarter but beat the Zacks Consensus Estimate of $25,747 million. The sales decline is attributed to one extra week in the fourth quarter of fiscal 2018, which contributed incremental sales of $1.7 billion. The company's overall comps grew 5.2%, with a 5.3% improvement in the United States.
In the reported quarter, comps were aided by 4.1% rise in average ticket, offset by a 6.4% decline in customer transactions. Moreover, sales per square foot rose 2.8%.
In dollar terms, gross profit declined 3.2% to $8,736 million from $9,027 million in the year-ago quarter, primarily driven by soft sales. Further, gross profit margin contracted 20 basis points (bps) to 33.9%.
Operating income rose 0.7% to $3,403 million, while operating margin expanded 40 bps to 13.2%. Despite a decline in gross margin, operating margin benefited from a decrease in SG&A expenses.
Balance Sheet and Cash Flow
Home Depot ended fiscal 2019 with cash and cash equivalents of $2,133 million, long-term debt (excluding current maturities) of $28,670 million, and shareholders' deficit of $3,116 million. In fiscal 2019, it generated $13,723 million of net cash from operations.
In fiscal 2019, the company paid out cash dividends of $5,958 million and repurchased shares worth $6,965 million.
Moreover, it hiked its quarterly dividend by 10% to $1.50 per share, which indicates an annualized dividend of $6.00 per share. The raised dividend is payable Mar 26, 2020, to shareholders of record as of Mar 12.
Outlook
The company noted that fiscal 2019 was a year of significant progress on its One Home Depot investment plan. Home Depot is in the second year of the aforementioned plan. Through the two years, the company increased sales by more than $9 million.
Backed by the progress on the One Home Depot investments, it provided a strong view for fiscal 2020. It expects sales growth of 3.5-4% for fiscal 2020, with comps growth of 14%.
Moreover, the company expects operating margin of 14% and net interest expenses of $1.2 billion for fiscal 2020. Effective tax rate is anticipated to be 24%. For fiscal 2020, the company projects earnings per share of $10.45, suggesting 2% growth from the reported in fiscal 2019.
Additionally, it plans to open six stores in fiscal 2020. It expects to repurchase shares worth at least $5 billion. Capital expenditure is likely to be $2.8 billion, with depreciation and amortization expenses of $2.4 billion. Moreover, the company expects cash flow from operating activities of $13.5 billion.
3 Better-Ranked Retail Stocks
BMC Stock Holdings, Inc. (NASDAQ:BMCH) delivered average positive earnings surprise of 29.3% in the trailing four quarters. It presently carries a Zacks Rank #2 (Buy). You can see the complete list of today’s Zacks #1 Rank (Strong Buy) stocks here.
Builders FirstSource, Inc. (NASDAQ:BLDR) delivered average positive earnings surprise of 30% in the trailing four quarters. It currently carries a Zacks Rank #2.
Costco Wholesale Corporation (NASDAQ:COST) has a long-term earnings growth rate of 8.1% and a Zacks Rank #2 at present.
The Hottest Tech Mega-Trend of All
Last year, it generated $24 billion in global revenues. By 2020, it's predicted to blast through the roof to $77.6 billion. Famed investor Mark Cuban says it will produce "the world's first trillionaires," but that should still leave plenty of money for regular investors who make the right trades early.
See Zacks' 3 Best Stocks to Play This Trend >>
The Home Depot, Inc. (HD): Free Stock Analysis Report
Costco Wholesale Corporation (COST): Free Stock Analysis Report
Builders FirstSource, Inc. (BLDR): Free Stock Analysis Report
BMC Stock Holdings, Inc. (BMCH): Free Stock Analysis Report
Original post
Zacks Investment Research