
The Home Depot, Inc. (NYSE:HD) posted better-than-expected earnings results for second-quarter fiscal 2019, retaining its beat streak of more than five years. However, the company’s top line lagged estimates but improved year over year.
Its earnings were fueled by significant progress on strategic investments. Further, a favorable consumer environment in the United States and steady housing market aided its results.
However, the company slashed its sales and comparable sales (comps) view for fiscal 2019 on lumber price deflation and expectations of potential impacts of the newly enacted tariffs.
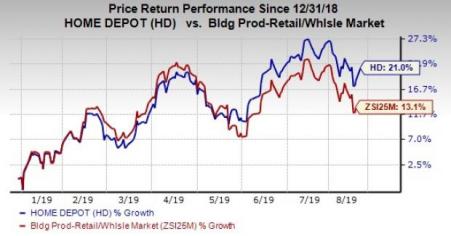
Shares of the home-improvement retailer moved up 0.5% in the pre-market session on mixed sentiments of an earnings beat and a sales lag, combined with a lowered sales view for fiscal 2019. Nonetheless, this Zacks Rank #3 (Hold) stock has gained 21% year to date, outpacing the industry’s growth of 13.1%.
Q2 Highlights
Adjusted earnings of $3.17 per share grew 3.9% from $3.05 registered in the year-ago quarter. The bottom line also surpassed the Zacks Consensus Estimate of $3.08.
The Home Depot, Inc. Price, Consensus and EPS Surprise
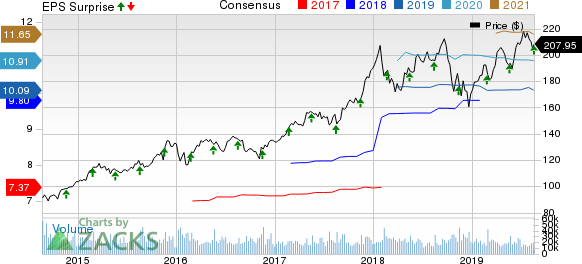
The Home Depot, Inc. price-consensus-eps-surprise-chart | The Home Depot, Inc. Quote
Net sales rose 1.2% to $30,839 million from $30,463 million in the year-ago quarter but missed the Zacks Consensus Estimate of $30,953 million. Sales benefited from robust comps performance throughout the quarter under review, partly offset by lower lumber prices. The company's overall comps grew 3% while the same grew 3.1% in the United States.
During the reported quarter, comps were aided by 1.7% rise in average ticket while customer transactions remained flat with last year. Moreover, sales per square foot rose 1.1%.
In dollar terms, gross profit inched up 0.6% to $10,432 million from $10,365 million in the year-ago quarter, primarily driven by higher sales. However, gross profit margin contracted 20 basis points (bps) to 33.8%.
Operating income dipped 0.1% to $4,896 million while operating margin contracted 20 bps to 15.9%.
Balance Sheet and Cash Flow
Home Depot ended the quarter with cash and cash equivalents of $2,547 million, long-term debt (excluding current maturities) of $27,064 million, and shareholders' deficit of $1,160 million. In the first half of fiscal 2019, it generated $8,497 million of net cash from operations.
Further, the company paid out cash dividends of $2,991 million and repurchased shares worth $2,619 million in the first half of fiscal 2019.
Outlook
Home Depot notes that lumber prices have declined significantly in the past year, which should hurt sales in quarters head. Driven by the deflation in lumber prices as well as accounting for the potential impacts of the newly announced tariffs on U.S. consumers, the company lowered its sales growth guidance for fiscal 2019. Nevertheless, it reiterated the earnings view for the fiscal year, citing continued tailwinds from strategic investments, a favorable consumer backdrop and steady housing market.
The company now expects sales growth of nearly 2.3% in fiscal 2019 compared with 3.3% rise stated earlier. Comps (for the comparable 52-week period) are now anticipated to rise 4% compared with 5% growth mentioned previously. The company continues to project earnings per share of $10.03 for fiscal 2019, suggesting nearly 3.1% growth from the year-ago reported figure.
Check These 3 Better-Ranked Retail Stocks
BMC Stock Holdings, Inc. (NASDAQ:BMCH) delivered average positive earnings surprise of 31.5% in the trailing four quarters. It presently sports a Zacks Rank #1 (Strong Buy). You can see the complete list of today’s Zacks #1 Rank stocks here.
Builders FirstSource, Inc. (NASDAQ:BLDR) delivered average positive earnings surprise of 26.6% in the trailing four quarters. It currently carries a Zacks Rank #2 (Buy).
Canada Goose Holdings Inc. (NYSE:GOOS) has a long-term earnings growth rate of 28.5% and a Zacks Rank #2 at present.
Legalizing THIS Could Be Even Bigger than Marijuana
Americans spend an estimated $150 billion in this industry every year… more than twice as much as they spend on marijuana.
Now that 8 states have fully-legalized it (with several more states following close behind), Zacks has identified 5 stocks that could soar in response to the powerful demand. One industry insider described the future as “mind-blowing” – and early investors can still get in ahead of the surge.
See these 5 “sin stocks” now >>
The Home Depot, Inc. (HD): Free Stock Analysis Report
Builders FirstSource, Inc. (BLDR): Free Stock Analysis Report
BMC Stock Holdings, Inc. (BMCH): Free Stock Analysis Report
Canada Goose Holdings Inc. (GOOS): Free Stock Analysis Report
Original post
Zacks Investment Research