Summary: Higher environmental standards are being blamed for job losses in mining and manufacturing. A few months ago, foreign trade was to blame. Both reasons are wrong: 80% of these job losses are due to new technologies, not trade or environmental standards.
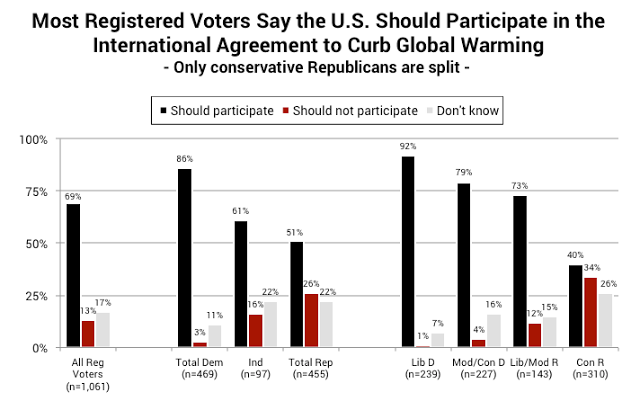
It's hard to argue that reducing carbon emissions has been economically harmful: the US is in the midst of its longest streak of jobs growth in its history. Coal employment fell 75% in the 20 years before the Environmental Protection Agency was even founded. Solar jobs are now three times greater than coal jobs, and growing fast. Cities like Pittsburgh have shed manufacturing jobs but gained three times as many "new economy" jobs in healthcare and technology. For these reasons, many Fortune 500 companies - including Exxon-Mobil (NYSE:XOM), Chevron (NYSE:CVX) and Conoco (NYSE:COP) - support efforts to curb emissions. American voters support the Paris Agreement by a wide 5:1 margin.
It's true that China is the world's largest source of annual CO2 emissions and home to many of Earth's most polluted cities. But China's emissions are overwhelmingly a function of its enormous size and its booming exports to the rest of the world. On a consumption basis, China's emissions are 20% more than the US but its population is 330% larger. About 30% of China's emissions are due to consumption in the US and elsewhere.
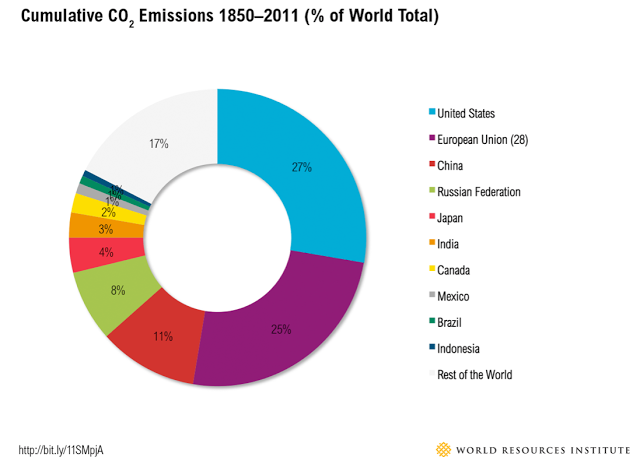
The uncomfortable truth is that the US and the EU are the largest polluters in history. They are responsible for well over half the cumulative buildup of greenhouse gases in the atmosphere. The consumer habits of the average American creates emissions that are twice that of the average European, nearly 4 times that of the average Chinese and 18 times that of the average Indian.
Higher environmental standards are being blamed for job losses in mining and manufacturing. A few months ago, foreign trade was to blame. Both reasons are wrong: 80% of job losses in these areas are due to new technologies (article). We discussed this in a recent post here.
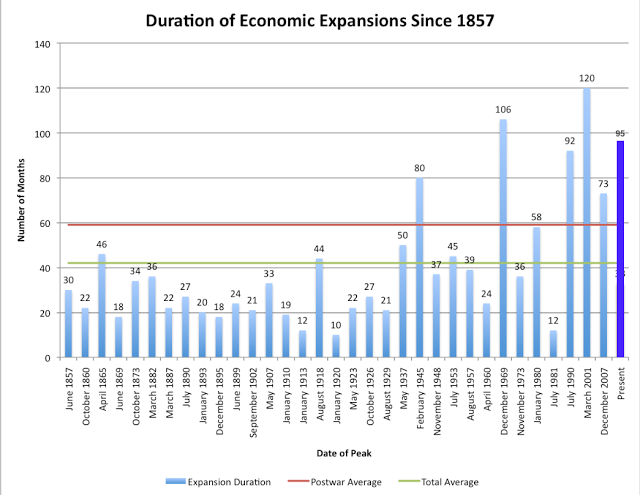
It's hard to argue that reducing emissions in the US has been economically harmful: regulations are far more stringent now than at any other time yet the US is in the midst of its longest streak of jobs growth - 79 straight months - in its history. The current economic expansion is the 3rd longest in history.

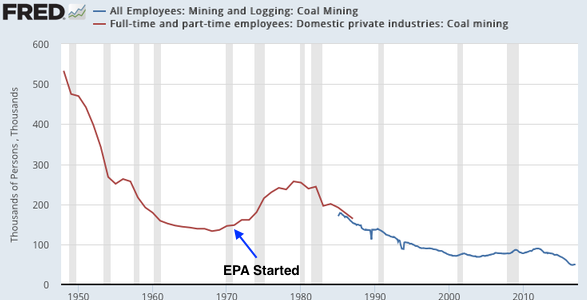
The poster child for job killing environmental regulations is coal mining, but coal employment fell 75% in the 20 years before the Environmental Protection Agency (EPA) was founded in 1970. Over the past 30 years, coal employment has fallen by another 1/3 yet coal production was at an all-time high as recently as 2008. New technology and lower cost sources of power (like natural gas and, increasingly, renewables) killed these jobs.
The same is true, more generally, in manufacturing. Manufacturing employment peaked in the 1940s, more than 70 years ago. As The Economist explains:
The manufacturing employment downtrend predates the end of Bretton Woods. It predates the union-crushing, deregulating era of the late 1970s and early 1980s. It predates the era of Japanese dominance, the rise of the Asian tigers, and the recent surge in Chinese growth. A plunging dollar, a "get tough" approach to China, and an embrace of industrial policy won't reverse this trend.
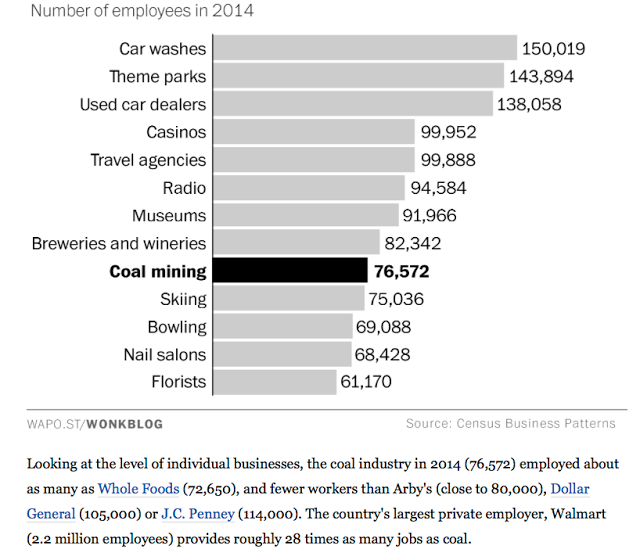
Today, employment in coal mining is comparable to that of the skiing industry (ironically, an industry that is highly impacted by a changing climate). Even Arby's employs more people than coal; Walmart (NYSE:WMT) provides 28 times as many jobs (from The Washington Post).
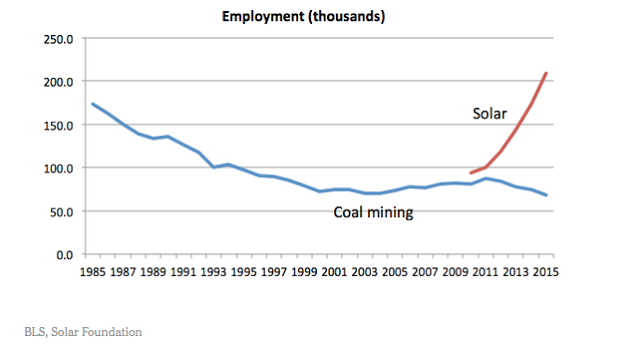
Between 2009 and 2015, solar and wind energy consumption tripled in the US. Solar and wind accounted for two-thirds of the generation capacity added in 2015. Solar jobs are perhaps 3 times greater than coal jobs, and growing fast. It would be more accurate to say that environmental standards contributed to technological innovation and the advent of new industries and jobs.
Despite recent initiatives, the US still lags countries in Europe, which have moved more quickly to renewable energy generation. In April, 64% of Germany's power came from renewable sources, such as solar and wind. In March, the UK celebrated its first day since the Industrial Revolution when it didn’t burn coal (article).
Perhaps no other city in America better exemplifies how the US economy can successfully adapt, even thrive, when old industries become obsolete than the former steel and coal town of Pittsburgh. In the past 20 years, that city lost 83,000 manufacturing jobs but gained 249,000 education and health services jobs. It is now home to large offices for Google (NASDAQ:GOOGL) and Amazon (NASDAQ:AMZN) as well as 10,000 new start ups. Says the mayor of Pittsburgh:
During the 80s and 90s, we said our future economy may not be based on big manufacturing and we were able to turn the corner and build a new economy. Pittsburgh is the poster child of showing why the Paris Agreement is good economics for the United States.
For all these reasons, Corporate America also supports efforts to reduce carbon emissions. For example, more than 70 of the Fortune 500 recently reiterated their support for the Paris Agreement on climate. This includes fossil fuel producers Exxon-Mobil, Chevron and Conoco (article). Larry Fink, the CEO of the world’s largest asset manager specifically highlighted the Paris Agreement in a letter urging S&P 500 CEOs to focus more on long-term value creation. As major business leaders argue in an ad in the WSJ (here):
By expanding markets for innovative clean technologies, the (Paris) Agreement generates jobs and economic growth. U.S. companies are well positioned to lead in these markets. Withdrawing from the agreement will limit our access to them.
Likewise, Americans voters support the Agreement by a wide 5:1 margin (from Yale).
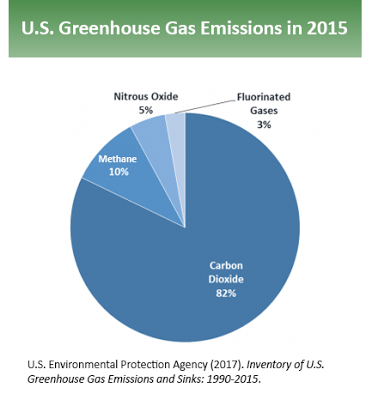
Some background on carbon emissions.
Greenhouse gases trap heat in the atmosphere, leading to changes in the climate on Earth. The most prevalent greenhouse gas is carbon dioxide (CO2), which enters the atmosphere when fossil fuels (gas, oil and coal) and wood are burned, and when cement is manufactured. In the US, about 82% of annual greenhouse gas emissions come from CO2 alone (from the EPA).
It's the cumulative buildup of greenhouse gases over time, not the emissions in a particular year, that cause changes in the climate. Country-level emissions of CO2 go back to 1850. So, who has been responsible for most of the changes in the climate? The US and the EU, who account for over half of cumulative emissions. China and India account for 11% and 3%, respectively (from WRI).
Why are developed (rich) countries the largest contributors to CO2 emissions? Because, as Exxon CEO Darren Woods explains, "energy needs are a function of population and living standards." The US and the EU have large populations and are intense energy users: their consumption per person has been several orders of magnitude greater than in developing (poor) countries.
Let's look at the annual emissions data more closely to understand why this is.
It is true that China is by far the largest producer of total CO2 emissions. The US is the second largest, the 28 countries in the European Union are third, India is fourth and Russia is fifth. Primary data in the tables below from the World Bank.
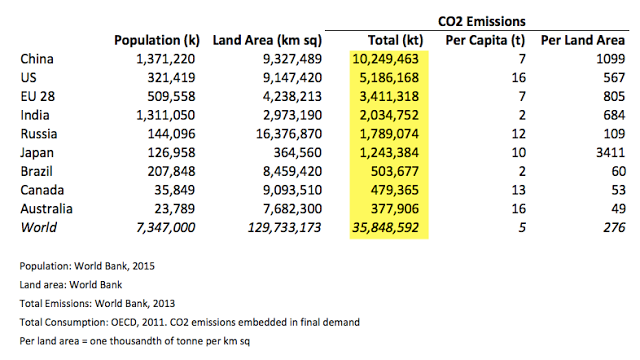
As the Exxon CEO said, total emissions are primarily related to population: the four largest producers are also the four largest countries based on population. That should be unsurprising, as highly populated countries need to support the most people. The nine countries listed above account for 70% of global emissions and 55% of the global population.
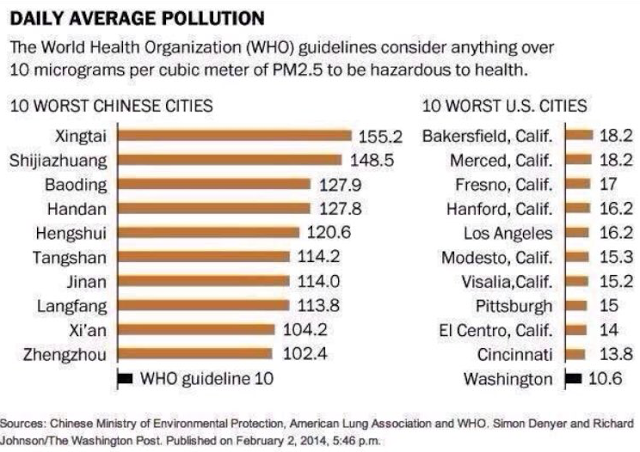
China is also home to many of the most polluted cities on Earth. Pollution levels are far in excess of health guidelines. That said, comparing pollution between Chinese and American cities is misleading. For example, the most polluted city in China, Xingtai, has a population that is 19.5 times larger than Bakersfield, the most polluted city in the US. Comparing these cities would be like comparing the pollution in Los Angeles to Sonoma or Monterey counties (from The Washington Post).
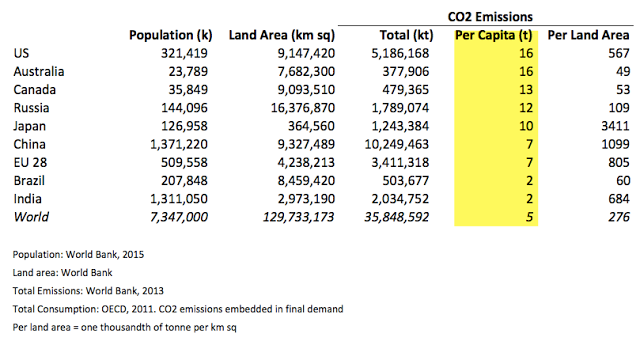
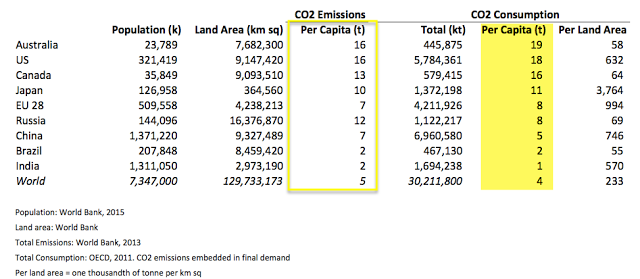
So it is more accurate to look at CO2 emissions per person. On this basis, the US and Australia are the largest source of emissions, followed by Canada and Russia. The EU and China are less than half of those countries while India is 1/8th.
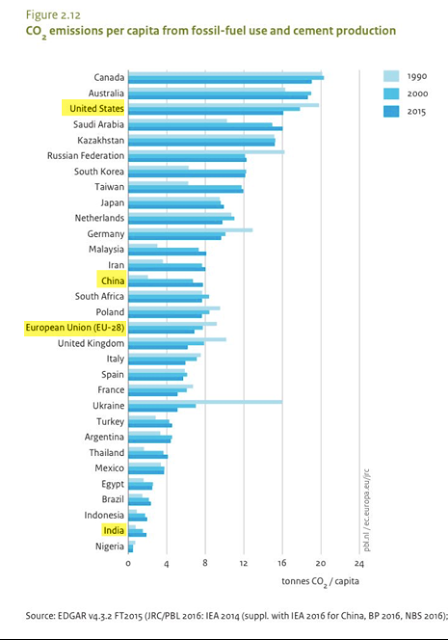
Again, as the Exxon CEO explained, per person CO2 emissions are also a function of living standards: five of the seven largest producers per person are also the richest and most developed. Less economically developed countries like India and Brazil are relatively minor emitters per person.
The US, Australia and Canada produce 3 times more emissions per person than the average for the world. These countries are heavy producers of global emissions. China and the EU are close to the average while India is less than half the average.
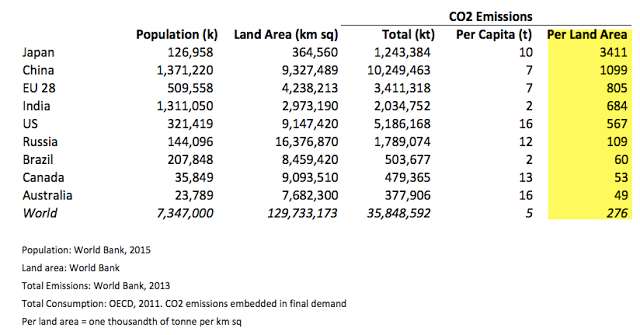
Another way to measure relative CO2 emissions would be by country geographic size, but this is unhelpful as land area has little to do with the amount of emissions associated with economic production. For example, the US is roughly the same size and has the same income level as Canada and Australia yet emits over 10 times more CO2 per kilometer. Japan's population density results in the largest emissions per kilometer.
All of the tables above use CO2 production. But this is not the best way to evaluate CO2 emissions. Why? Because production can be moved outside the country and the goods then imported, reducing CO2 production in one country and increasing it in another. What matters most is final demand, which drives total emissions. This gets at the affect of living standards on emissions.
Especially over the past 30 years, the production of goods has moved outside the US and the EU to lower cost countries: Nike (NYSE:NKE) makes shoes in Asia but most shoes are consumed elsewhere; Carrier moved production to Mexico and then imports the finished goods to the US; Ford and GM have global supply chains for vehicles primarily consumed in North America.
The impact of outsourced production is easily seen in the data. Over the past 20 years, developed countries have reduced their emissions per person as production has moved to lower cost countries (and as new technologies to reduce emissions at home have been created). Meanwhile, emissions in places like China have escalated as they have become major exporters (and as their living standards have dramatically improved).
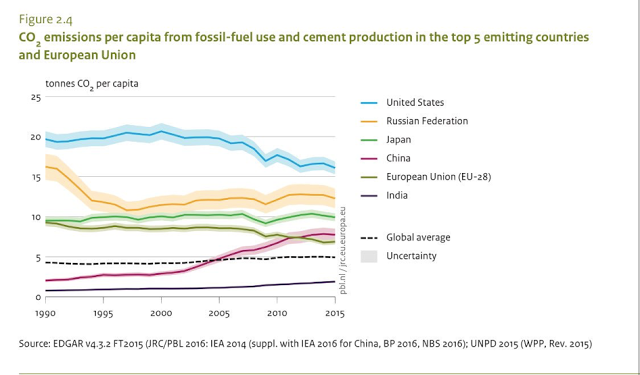
Since each country's final demand affects global emissions, a better measure is CO2 consumption, defined as the amount of CO2 emissions embedded in each country's consumption of goods. This has a significant impact on identifying which countries are ultimately responsible for creating CO2 emissions.
On this basis, China is the largest total CO2 consumer, followed by the US, the EU, India and Japan. This is roughly the same order as for CO2 production shown above, but the relative amounts are very different. For example, China's production is twice the US's, but its consumption is only 20% greater. Consumption data from the OECD.
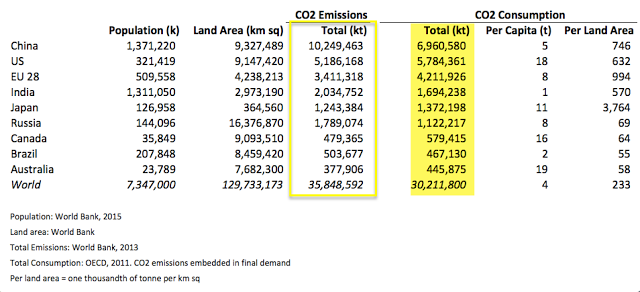
Why is this? Because emerging markets' production is consumed by developed markets. In the table above, note that the US consumes 10% more than it produces, while Australia, Canada and the EU each consume about 20-25% more (differences in the data year understate these somewhat). Meanwhile, China's consumption is about 30% less than its production (differences in the data year overstate these somewhat).
Per person, consumption in Australia, the US and Canada is responsible for the most CO2 emissions. The consumption habits and higher living standards of rich countries is responsible for per person emissions that are 2-4 times greater than for China and up to 10 times greater than for Brazil. The consumption of the average Indian creates emissions that are 1/18th the average American.
While CO2 emissions are the most significant source of greenhouse gases, they are not the entire story. Changes in land use have a substantial impact on the Earth's climate. Deforestation in places like Brazil and Indonesia reduces carbon capture and thus amplify the affect of emissions. These effects have not been reflected in the charts above.
The Paris Agreement is by far the most significant global effort to date aimed at addressing climate change, uniting for the first time ever nearly country on Earth. Some background on this Agreement:
The Paris Agreement was reached in December, 2015 and was accepted by all but two of 197 countries, including both China and India.
Under this Agreement, each country makes their own voluntary, non-binding plan to reduce their greenhouse gas emissions. A country can adjust any goal if it decides it cannot be met. There is no financial penalty or liability exposure to remaining in the Agreement if goals are not met. In short, there is never a need for a country to seek a "renegotiation" of the Agreement (from FactCheck and Vox).
Remaining in the Agreement not only encourages other countries to do so but makes it more likely that US industry remains at the forefront. This point was highlighted by major US business leaders (above). For example, China plans to meet its emissions targets under the Agreement by terminating construction of more than 100 coal-fired plants and investing more than $360 billion into wind and solar projects by 2020. It's coal-fired plants are shifting to "clean coal" (power plants that capture and store or use the CO2 pollution, keeping much or all of it from going into the atmosphere). These investments represent new business opportunities for US companies.
The related Green Climate Fund is a $10.1 billion funding mechanism under the UN created to support the Paris Agreement. It uses funds collected from industrialized (rich) countries to help developing (poor) countries mitigate and adapt to climate change through, for example, greater use of renewable energy. That's the right concept since, as we have seen, developed countries have by far contributed the most to CO2 emissions. The Fund has so far supported 43 investments.
The EU has committed the most to the Fund: $4.7 billion. The US has pledged $3 billion, of which it has paid $1 billion. This amounts to $9 per person if the US fulfills its pledge, an insignificant amount of money. On a per capita basis, the US pledge ranks 11th (more here and here).
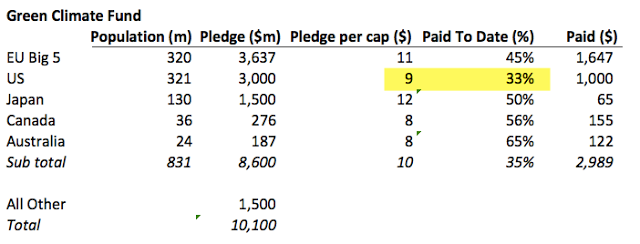
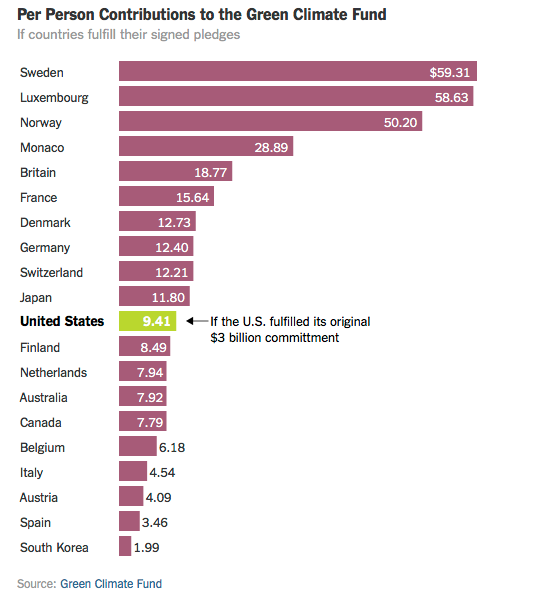
By design, China and India are not contributors to the Fund, they are recipients. The main contributors are rich countries with a GDP per capita of about $50,000. In comparison, China's is $8000 and India's is just $1500.
In summary, higher environmental standards and reduced carbon emissions have not harmed the US economy. They have arguably contributed to technological innovation and the advent of new industries and better jobs. These facts are supported by many US business leaders as well as by a large majority of American voters.
China is a large source of emissions, but not relative to its enormous population. The uncomfortable truth is that the US and the EU are the largest polluters in history. The average American creates emissions that are twice that of the average European, nearly 4 times that of the average Chinese and 18 times that of the average Indian.
