
The U.S. stock market indexes lost between 0.6% and 1.2% on Wednesday, extending their short-term downtrend, as investors' sentiment further worsened. The S&P 500 got very close to the level of 2,800 before bouncing off that support level. It currently trades 1.9% below the January's 26th record high of 2,872.87. The Dow Jones Industrial Average lost 0.6% and the technology NADSDAQ Composite lost 1.2% on Wednesday.
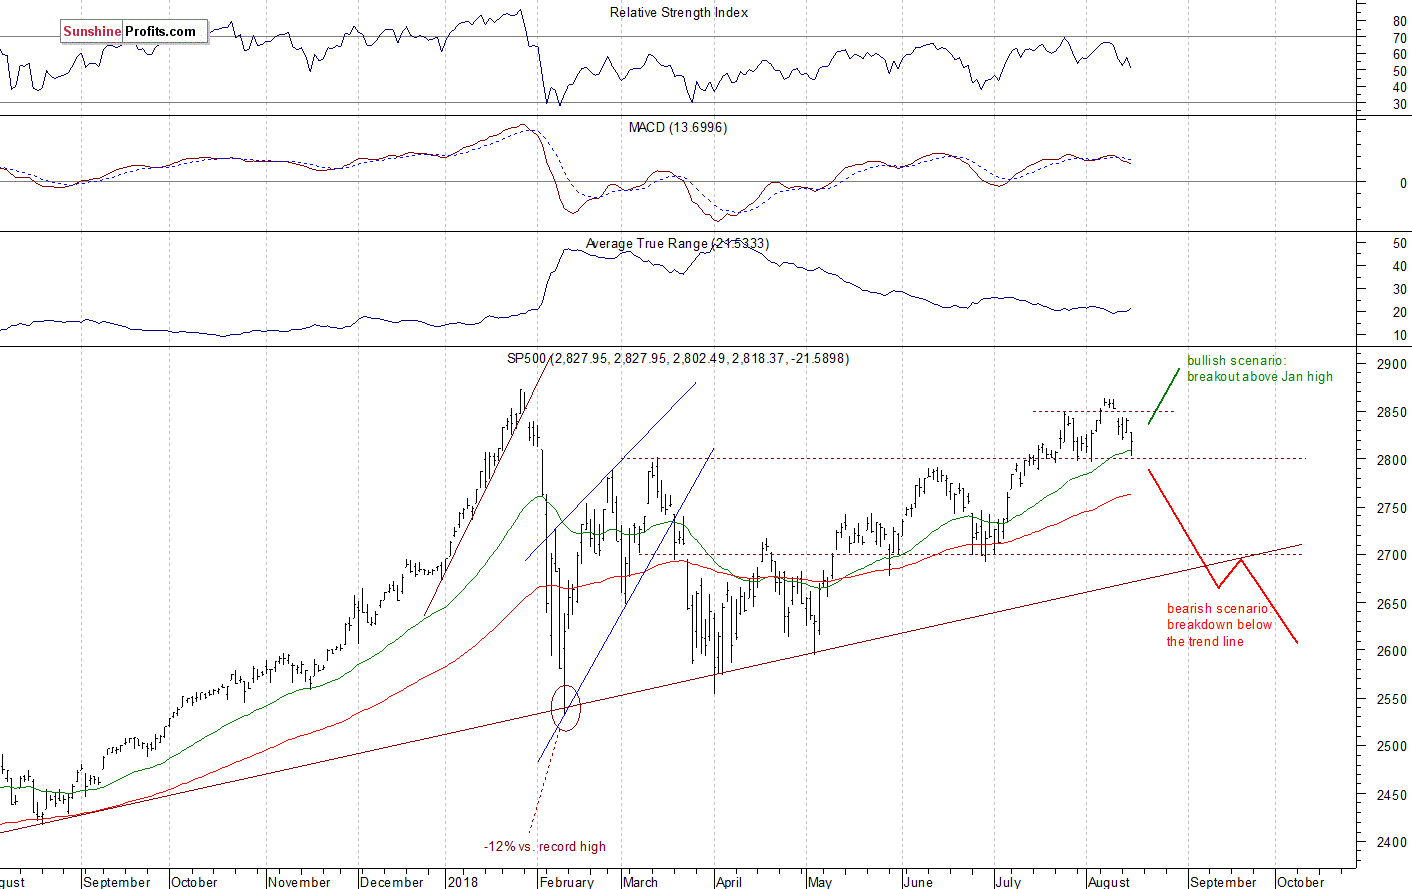
The nearest important level of support of the S&P 500 is now at around 2,800-2,805, marked by the recent local lows. The next level of support is at 2,780-2,790, among others. On the other hand, the level of resistance is now at around 2,825, marked by the recent support level. The resistance level is also at 2,845-2,850, marked by last Friday's daily gap down of 2,842.20-2,851.98.
The broad stock market got close to its January's record high recently, as investors' sentiment improved following quarterly corporate earnings, economic data releases. The S&P 500 traded within a relatively narrow trading range in the middle of the last week. Then it broke lower on Friday. Was it some medium-term downward reversal or just downward correction before another leg up? There are still two possible medium-term scenarios - bearish that will lead us towards the February low again, and the bullish one - breakout higher towards 3,000 mark. The latter one got very real recently. However, the S&P 500 index bounced off the resistance level marked by the January's record high last week:
New Uptrend or Just Upward Correction?
Expectations before the opening of today's trading session are positive, because the index futures contracts trade 0.5-0.8% higher vs. their yesterday's closing prices. The European stock market indexes have gained 0.5-0.6% so far. Investors will wait for some economic data announcements today: Housing Starts, Building Permits, Philadelphia Fed Manufacturing Index, Initial Claims at 8:30 a.m. The broad stock market will probably open higher and retrace some of its yesterday's decline. For now, it looks like an upward correction or a consolidation. There may be some more short-term uncertainty following the recent rout.
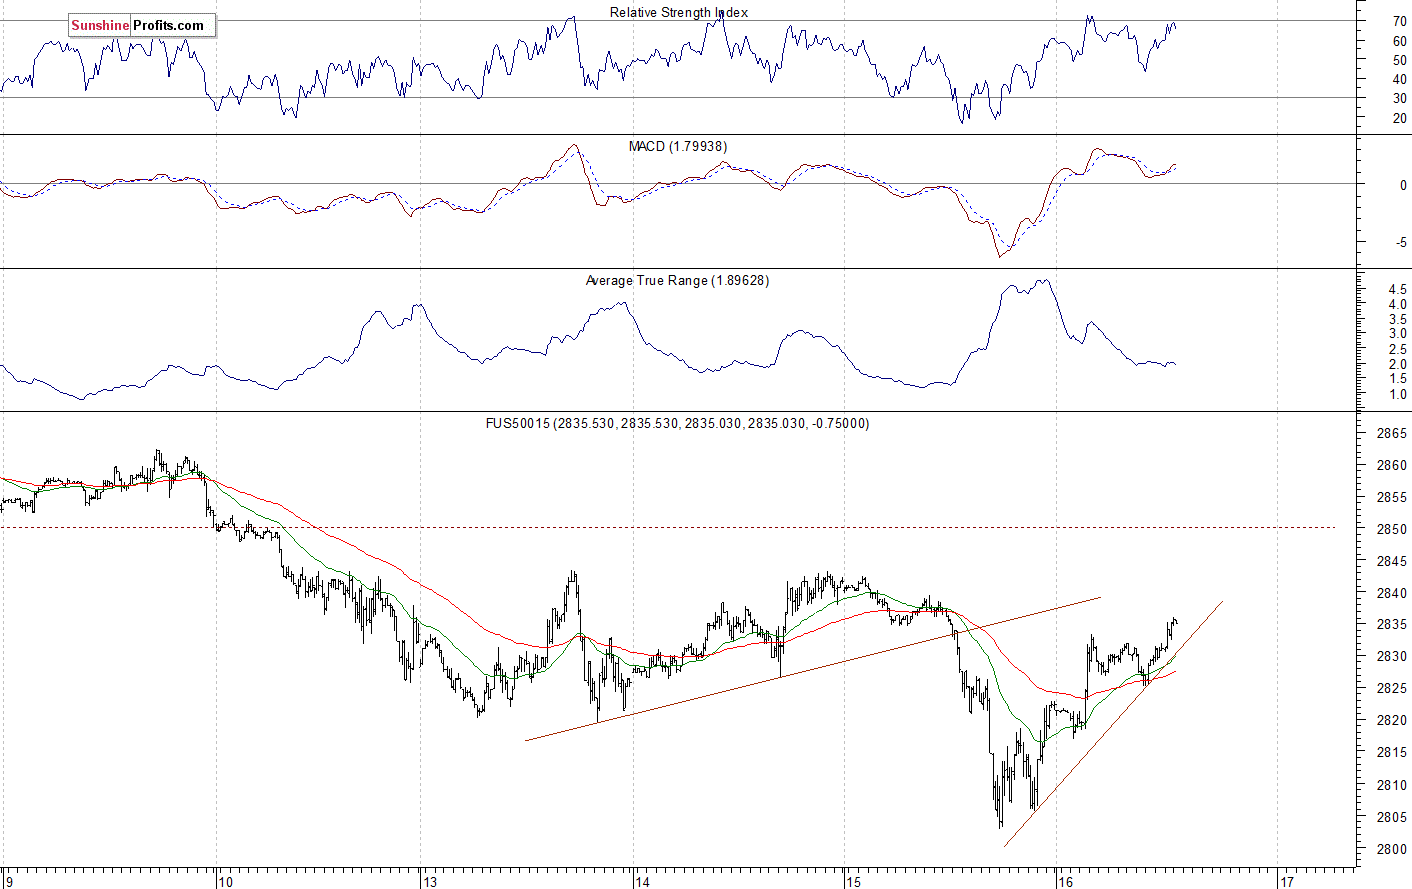
The S&P 500 futures contract trades within an intraday uptrend, as it retraces most of its Wednesday's intraday decline. The nearest important level of resistance is now at around 2,840-2,845, marked by the recent local highs. The resistance level is also at 2,850-2,855. On the other hand, the support level remains at 2,800-2,815. The futures contract trades closer to its recent local highs, as we can see on the 15-minute chart:
Nasdaq Also Higher
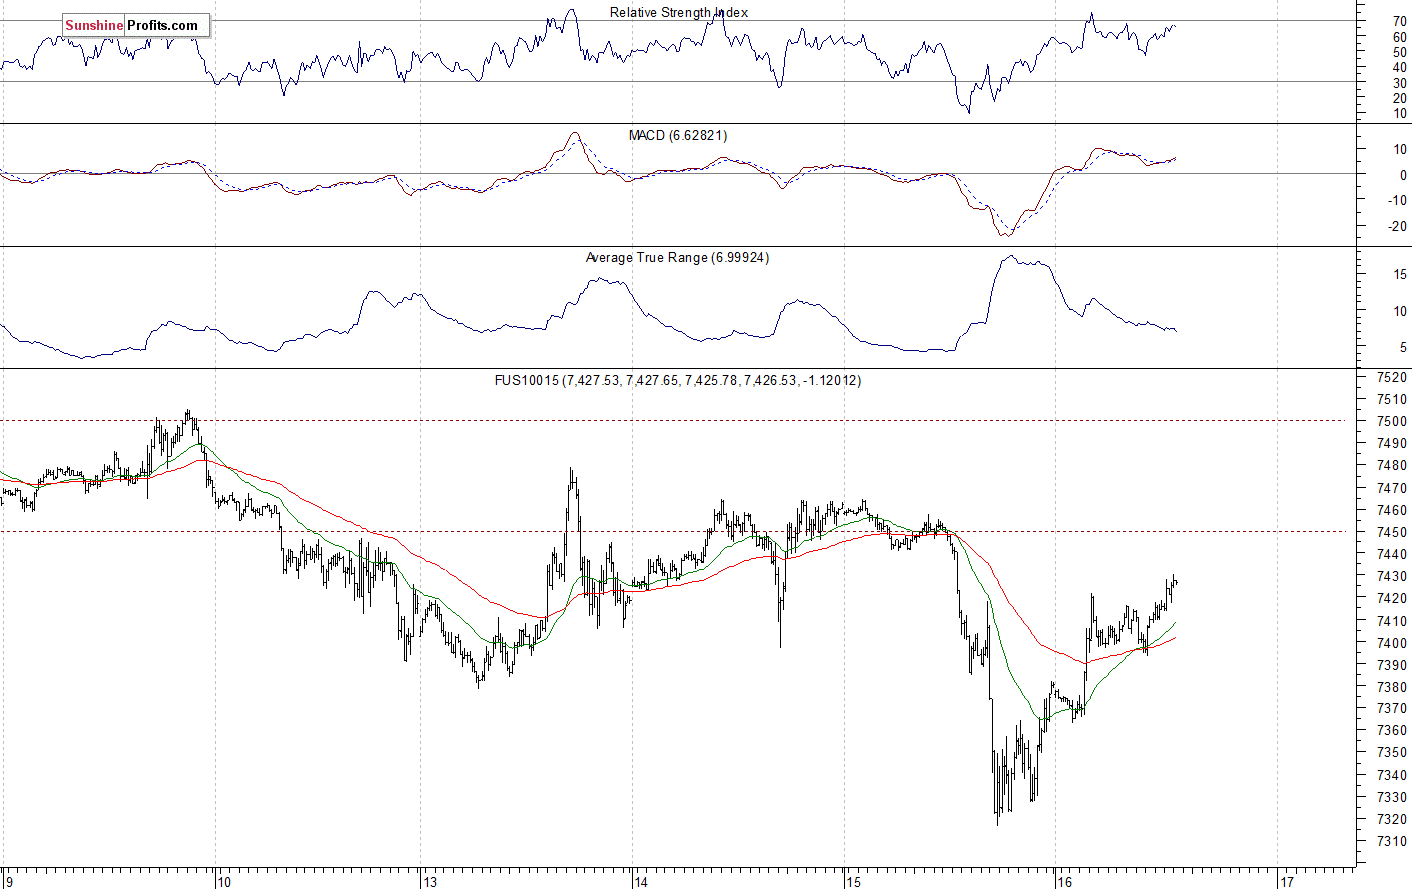
The technology Nasdaq 100 futures contract follows a similar path, as it retraces its recent sell-off, The market is back above 7,400 mark again. It is still relatively close to the record high of around 7,530. The nearest important level of resistance is at 7,450-7,470, marked by the local highs. On the other hand, the level of support is now at 7,300-7,350, among others. The Nasdaq futures contract trades within its short-term consolidation again, as the 15-minute chart shows:
Apple (NASDAQ:AAPL), Amazon Still Close to Their New Record Highs
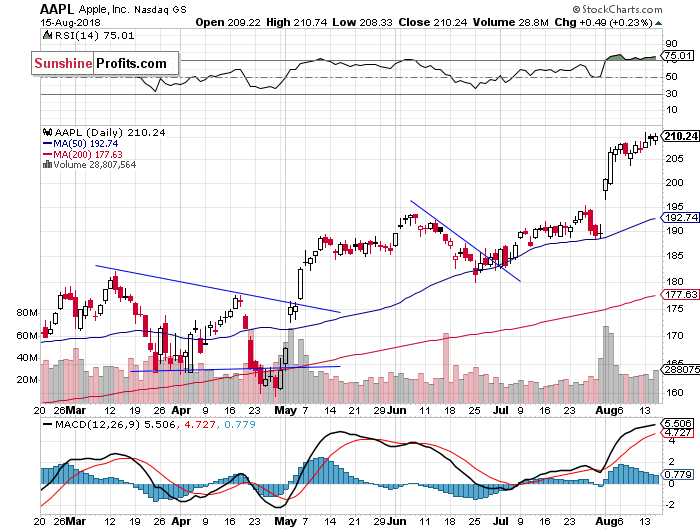
Let's take a look at Apple, Inc. stock (AAPL) daily chart (chart courtesy of http://stockcharts.com). Despite an overall broad stock market weakness it continues to trade along its Monday's new record high of $210.95. There have been no confirmed negative signals so far. However, we may see a downward correction at some point. The nearest important level of support is now at $190-200, marked by the previous resistance level:
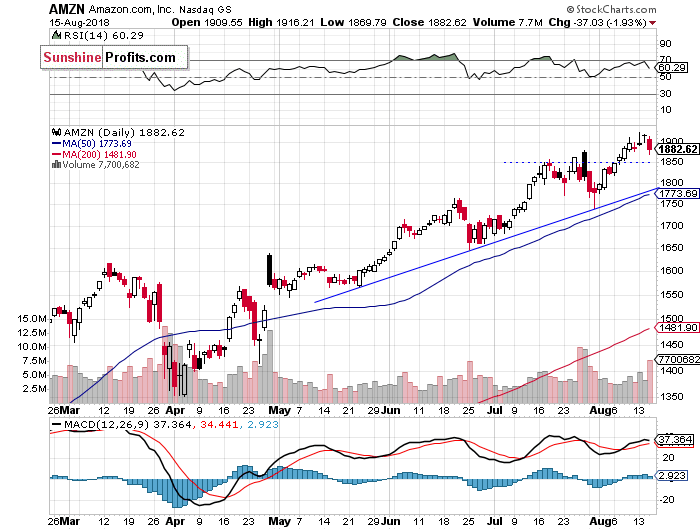
Now let's take a look at Amazon.com stock (NASDAQ:AMZN) daily chart. It has reached the new record high also on Monday at the level of $1,925.00. The nearest important level of resistance remains at around $1,925. On the other hand, support level is at 1,850. The stock continues to trade above its medium-term upward trend line, as we can see on the daily chart:
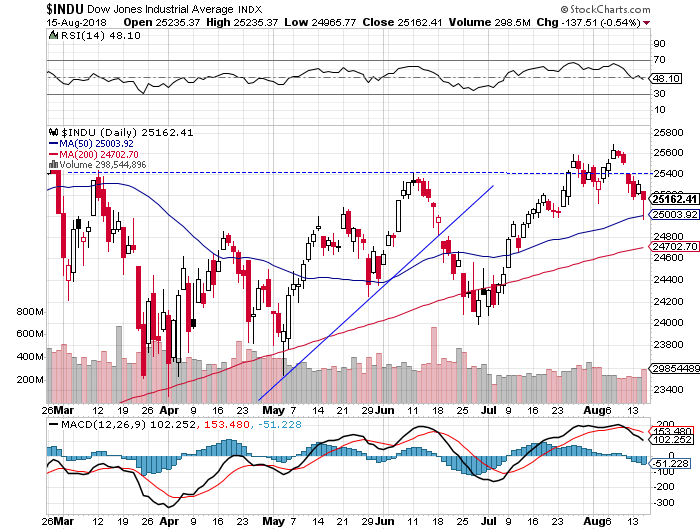
Dow Jones Bounces Off 25,000
The Dow Jones Industrial Average retraced more of its recent advance on Wednesday, as it reached the support level of 25,000. The blue-chip stocks gauge bounced off that level, but there have been no confirmed positive signals so far. Is this just downward correction or a new downtrend? For now, it looks like a correction. However, if the DJIA breaks below 25,000 mark, we could see more selling pressure:
The S&P 500 index bounced off support level of around 2,800 yesterday. Was it an upward reversal or just upward correction before another leg lower? We may see some more short-term uncertainty, as investors react to global news releases. However, we still can see a pretty mild stock market reaction to the Turkey crisis, trade war fears.
Concluding, the broad stock market will likely open higher today. Then we may see some more short-term uncertainty following last week's Friday's decline. The S&P 500 index bounced off 2,800 mark yesterday. It could be a new uptrend, but there are some resistance levels ahead.