
John Bean Technologies Corporation (NYSE:JBT) is on track with its Elevate plan that aims to drive persistent growth and margin expansion, and strategic acquisition program. Its ongoing restructuring plan will help improve effectiveness and productivity across all business units. Growing demand for protein, beverages and ready-to-eat meals are likely to be major drivers. However, lower order rates in the FoodTech segment and input cost inflation remain headwinds in the near term.
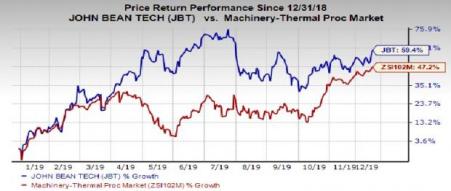
So far this year, the company’s shares have surged 59.4%, outperforming the industry's growth of 47.2%.
Let’s delve deeper into the factors that substantiate the company’s Zacks Rank #3 (Hold).
Upbeat Guidance: The company’s EPS guidance for 2019 is at $4.80-$4.90. Compared with earnings per share of $4.28 in 2018, the mid-point of the guidance range reflects growth of 13%. The company continues to expect organic growth of 2-3%. Acquisitions are now anticipated to contribute around 7% to growth.
For the FoodTech segment, the company guides full-year adjusted EBITDA margins of 19% to 20%, up more than 300 basis points from 2018. At AeroTech segment, the company anticipates adjusted EBITDA margins of 13-14%, up 150 basis points from 2018. For 2019, adjusted EBITDA is envisioned at $290-$300 million.
Positive Earnings Surprise History: John Bean Technologies outpaced the Zacks Consensus Estimate in the trailing four quarters by 34.55%, on average.
Positive Earnings Growth Projections: The Zacks Consensus Estimate for the company’s earnings for the ongoing year is currently pegged at $4.86, suggesting growth of 13.55% from the prior year. The same for 2020 stands at $5.25, indicating an improvement of 7.94% from the prior year. The stock also has long-term expected earnings per share growth rate of 9.4%, higher than the industry’s growth rate of 5.9%.
Solid ROE: The company’s ROE of 33.5% is higher than the industry’s 25.8%, highlighting the company's tactical efficiency in utilizing shareholders' funds.
Growth Drivers in Place: John Bean Technologies’ Elevate plan is likely to drive persistent growth and margin expansion. Per the plan, the company is focusing on accelerating development of innovative products and services to provide customers with solutions, which in turn enhance their yield and productivity.
The company is capitalizing on extensive installed base to expand recurring revenues (which accounts for around 40% of total revenues) from aftermarket parts and services, equipment leases, consumables and airport services. This portion of the business has been seeing a CAGR of 9% over the past three years. In fact, it has further room for growth and will contribute to margins.
John Bean Technologies has a strategic acquisition program focused on companies that add complementary products. Further, its ongoing restructuring plan will help improve effectiveness and productivity in all business units.
The company is poised to perform well in the long run, courtesy of growing middle class, increasing protein and value-added food and beverage consumption globally.
However, there are a few factors that are impeding growth in the near term.
At FoodTech segment, current general economic and trade uncertainties have impacted the decision-making process among customers. This is reflected in the dip in the segment’s order rates. The imposition of tariffs on imports from China has led to input cost inflation, which will continue to put pressure on the company’s margins. Moreover, interest expenses have gone up reflecting the impact of incremental acquisition related debt and will impact earnings.
Stocks to Consider
Some better-ranked stocks in the Industrial Products sector are Northwest Pipe Company (NASDAQ:NWPX) , Tennant Company (NYSE:TNC) and Sharps Compliance Corp (NASDAQ:SMED) All of these stocks sport a Zacks Rank #1 (Strong Buy), at present. You can see the complete list of today's Zacks #1 Rank stocks here.
Northwest Pipe has an expected earnings growth rate of 15.8% for the current year. The stock has appreciated 46% year to date.
Tennant has a projected earnings growth rate of 29.8% for 2019. The company’s shares have gained 50% so far this year.
Sharps Compliance has an estimated earnings growth rate of 500% for the ongoing year. So far this year, the company’s shares have gained 24%.
Today's Best Stocks from Zacks
Would you like to see the updated picks from our best market-beating strategies? From 2017 through Q3 2019, while the S&P 500 gained +39.6%, five of our strategies returned +51.8%, +57.5%, +96.9%, +119.0%, and even +158.9%.
This outperformance has not just been a recent phenomenon. From 2000 – Q3 2019, while the S&P averaged +5.6% per year, our top strategies averaged up to +54.1% per year.
See their latest picks free >>
Tennant Company (TNC): Free Stock Analysis Report
John Bean Technologies Corporation (JBT): Free Stock Analysis Report
Northwest Pipe Company (NWPX): Free Stock Analysis Report
Sharps Compliance Corp (SMED): Free Stock Analysis Report
Original post
Zacks Investment Research