Fast casual restaurant chain Red Robin Gourmet Burgers (NASDAQ:RRGB) stock has been dormant during the pandemic recovery even as the benchmark S&P 500 index make new all-time highs. However, shares have finally awoken as money looks for laggard opportunities among the rapidly accelerating burger restaurants.
The recovery narrative coupled with the ever-increasing potential for a COVID-19 vaccine drawing closer, as well as a fear of missing out (FOMO) is bolstering demand for bargain stocks. With the shares still trading (-60%) below its February 2020 pre-COVID highs, prudent investors and nimble traders still take bargain entries on opportunistic pullbacks and trigger levels.
Q2 FY 2020 Earnings Release
On Aug 11, 2020, Red Robin released its second-quarter fiscal 2020 results for the quarter ending June 2020. It reported a non-GAAP earnings-per-share (EPS) loss of (-$3.31) versus consensus analyst estimates for a loss of (-$3.35), a (-$0.04) per share miss. Revenues dropped (-47.7%) year-over-year (YoY) to $161.12 million missing consensus estimates of $166.02 million. Comparable restaurant sales fell -41.4 YoY and comparable guest counts fell -38.5% YoY. Off-premise sales surged 208.7% YoY making up for 63.8% of total food and beverage sales.
COVID-19 Impacts
The financial impacts of COVID-19 was the major disruptive factor in the shortfalls. The Company also temporarily abated franchise royalties effective March 20. It resumed collecting partial royalties and advertising contributions in the latter part of the second quarter and doesn’t plan on collecting abated fees. Due to closed restaurants and 50% capacity restrictions during re-openings, guest count fell -36.2% YoY. On the bright side, the pivot to off-premise sales including carry-out, curbside and delivery grew by 208.7% YoY.
Dining rooms began opening in mid-May 2020 with “increasing sales trajectory” but had to “pivot again” to handle the pandemic resurgence in California with the closing of dining rooms again. Management stated they have regained momentum since the resurgence, with sequential improvement in weekly net sales for the past five weeks. Due to the California dining room closures with a weekly cash burn rate of -$2 million, the Company expects losses in Q3.
Pandemic Measures
Red Robin adopted a smaller menu composed of 1/3rd less items. This has resulted in improved operational efficiencies including faster ticket times and improved quality and consistency. Delivery options were provided directly through Red Robin Delivery services as well as third-party platforms. Red Robin has restructured landlord leases, cut costs and improved efficiencies. The January 2020 refinancing of its $300 million credit facility provides liquidity through early 2025, with a weekly cash burn rate of $1 million per week at partial occupancy rate. As of Aug. 9, the Company has $103 million in liquidity including $26 million cash and available borrowing capacity. Positive cash flow is expect before the end of the year.
Donato Pizza
The Company plans to rollout Donatos Pizza to 31 more restaurants in addition to the 48 Red Robins carrying it pre-pandemic. These restaurants experienced 700-basis point comp sales improvement on average. As more restaurants add their pizza product, sales are expected to accelerate quicker with the improved core staple mix that differentiates itself from other fast casual burger restaurants. Offering burgers and pizza is an unusual but winning combination that differentiates Red Robin from competitors like Shake Shack Inc (NYSE:SHAK), McDonald’s (NYSE:MCD), and Burger King (NYSE:QSR).

RRGB Opportunistic Pullback Price Levels
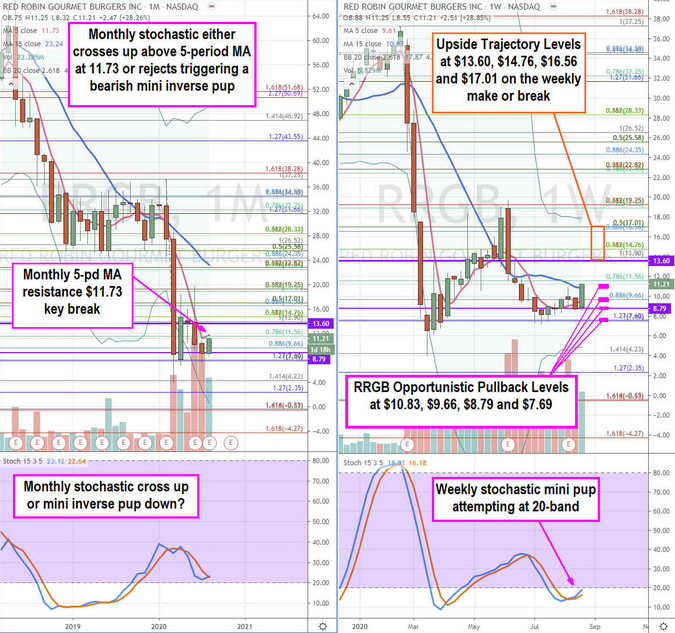
Using the rifle charts on the monthly and weekly time frames provides a broader view of the landscape for RRGB stock. The monthly rifle chart has been in a downtrend with key 5-period moving average (MA) resistance at $11.73. The stochastic is attempting to cross back up or rejects off the 5-period MA triggering a mini inverse pup back down. The weekly rifle chart is in a make or break formation with the 5 and 15-period MA bumper levels at $9.66 Fibonacci (fib) level and $10.83, respectively. The weekly rifle chart triggers a market structure low (MSL) buy above the $13.60, while the daily MSL triggered above $8.79. This makes the upside trajectories on a weekly mini pup logical at the $13.60 weekly MSL buy trigger, $14.76 fib, $16.56 and $17.01-$17.50 fib/daily upper Bollinger Bands® (BBs). If the weekly stochastic stalls on pullback then opportunistic pullback price levels are at $10.83 weekly 15-period MA, $9.66 fib/weekly 5-period MA, $8.79 daily MSL trigger and $7.69 fib. Since this is a laggard late mover, it may buy fade against a falling market initially. A monthly 5-period MA rejection is expected on initial tests at $11.73. However, this level can also be a breakout trigger if it holds on pullbacks since the 5-period MA is sloping up indicating rising bid support.
