The post-election euphoria has been amazing as the markets have surged more than 8% Trump won in November. Of course, the Trump's election was supposed to be a disaster, but that rhetoric quickly changed -- at least for the moment.
Not surprisingly, the media has reported each notch of “new highs” with joyful glee culminating with last week’s Barron’s cover “Get Ready For Dow 20,000”. It was not just Barron’s acting “giddy” over the millennial milestone, but the majority of the financial media and press has been salivating with anticipation of being able to don ball caps commemorating the occasion.
Unfortunately, for most investors, the headline is probably right. As I stated in the most recent newsletter:
I still suspect there is enough bullish exuberance currently to push the Dow to 20,000 and the S&P to 2,300 by the end of the year. However, I am more concerned about what happens next.
The reason I say it is “unfortunate” for most investors, is because investors have a tendency to do exactly the opposite of what they should do when it comes to investing – “Buy High and Sell Low.” The reality is that the emotions of greed and fear do more to cause investors to lose money in the market than if they were robbed at gun point.
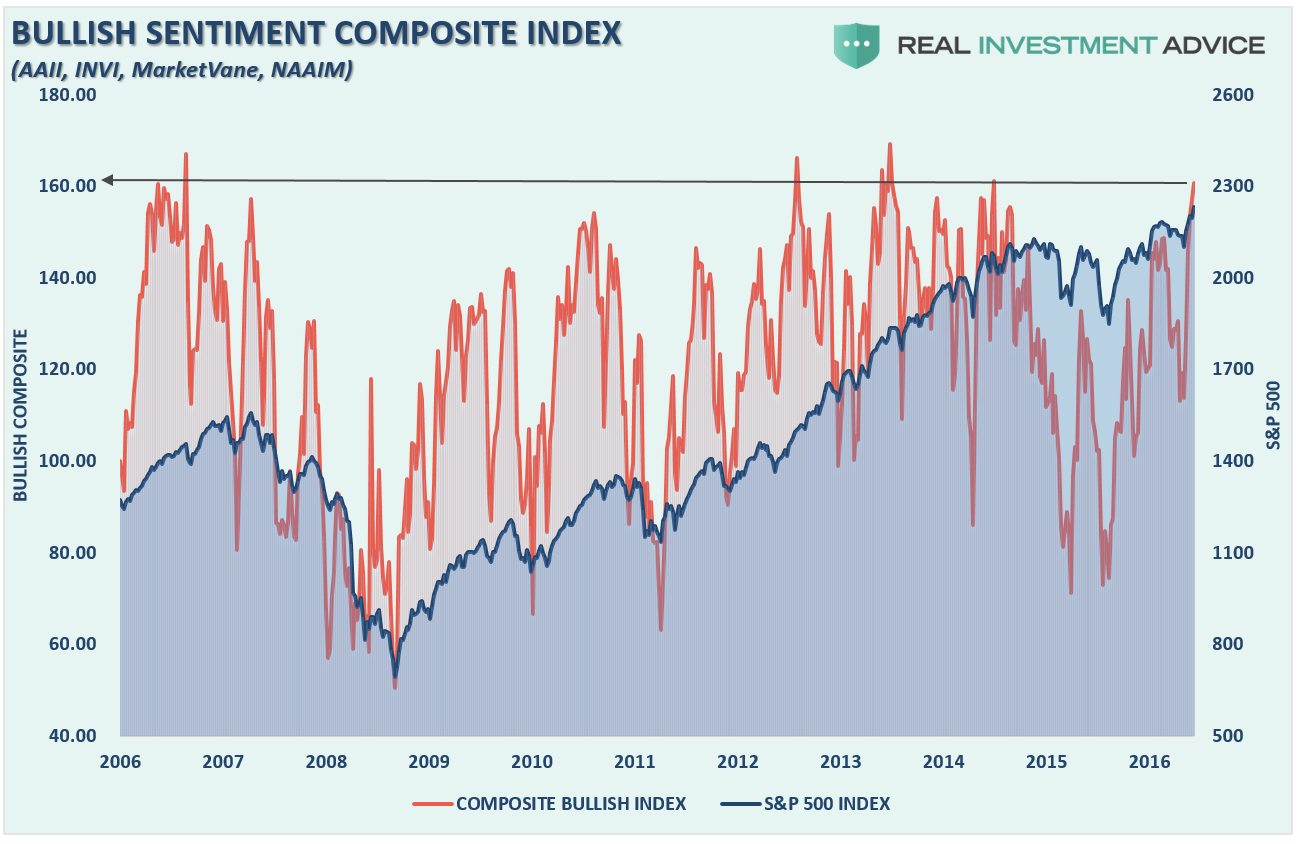
Take a look at the composite bullish sentiment chart below, which is a compilation of individual and professional investors. (AAII, INVI, MarketVane, and NAAIM)
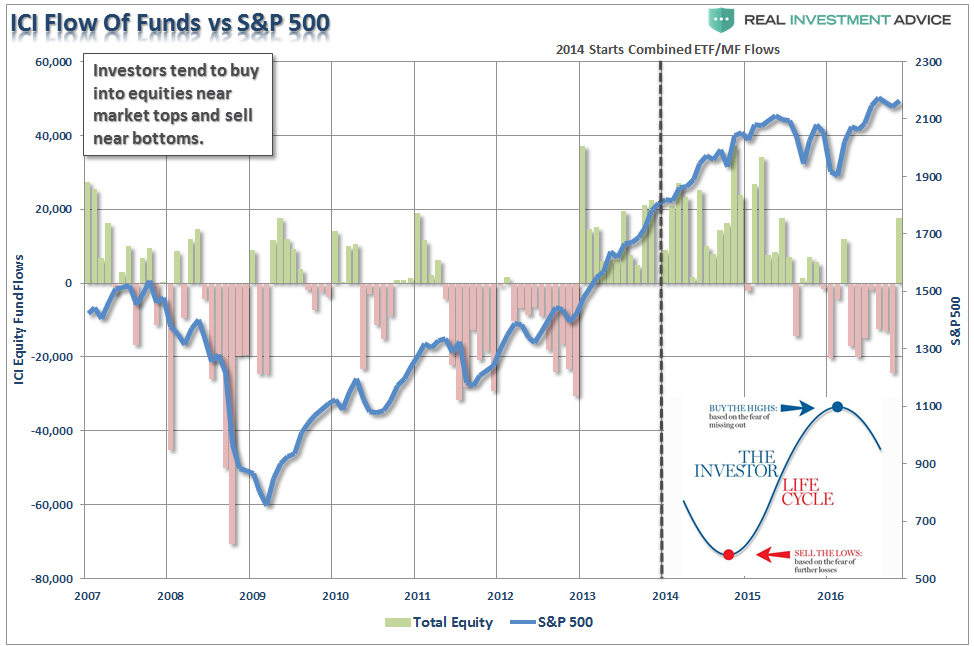
Typically, when sentiment has been this “bullish”, markets have been near short- to intermediate-term peaks, or worse. We can also examine investor behavior by looking at fund flows of individuals over time. Not surprisingly, investors tend to buy the most at or near market peaks and sell the most near market bottoms.
Since investors are mostly individuals with a “day job,” the majority of their “research” comes from a daily dose of media headlines. Therefore, since the media tends to “focus” their attention on “market-moving headlines,” either bullish or bearish, investors tend to “react” accordingly.
During market declines, investors tend to panic and sell out of stocks with the majority of the selling occurring near the lows. Conversely, as the markets begin to rally from deeply oversold conditions, investors continue to sell as they disbelieve the rally and are happy enough to get some of their money back. However, as the rally continues to advance, investors are “lured” back in as the “greed factor” overtakes their logic. Unfortunately, this buying always tends to occur at, or near, market peaks.
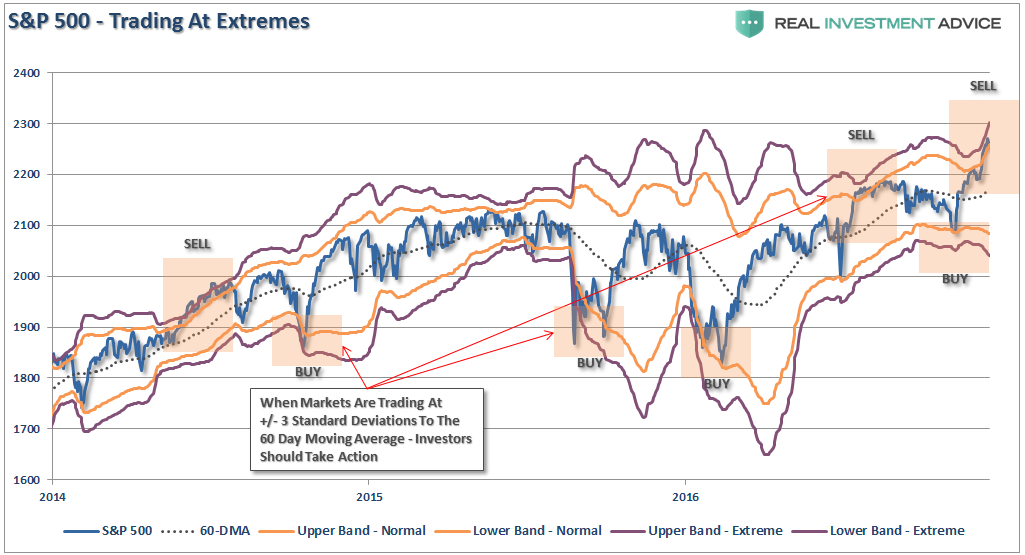
The market is like a rubber band. During bullish trends, the market can get stretched to extremes from the moving average for a short period of time before it snaps back.
The “Greater Fool” Theory
As investors, our job now is to be selling off our investments to those “greater fools” that are willing to overpay for an asset. Heading into the election, it was believed that if Donald Trump was elected, it would be “a crisis” for the markets. By election night, the market had sold off and was trading at 3-standard deviations below the moving average. Regardless of who won, the negativity of the market had set it up for a rally. Currently, at 3 standard deviations above the 60-day moving average, the “Donald-Trump-Is-Great” rally is likely complete as opposite extremes have now been reached.
This is not just a recent phenomenon but something seen at the peak and trough of every correction over time. The market is pushing extremes rarely seen at the beginning of a next “leg higher” in the markets.
So, while the media is busy putting on party hats and penning articles that the “Market Is Back” – just remember that we have been here before – both on the way up and the way down. More importantly, as I stated this past weekend:
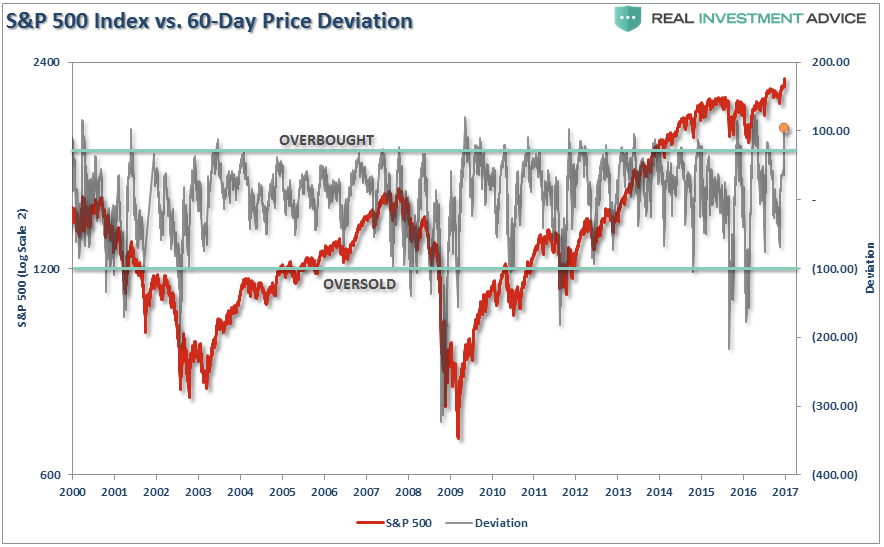
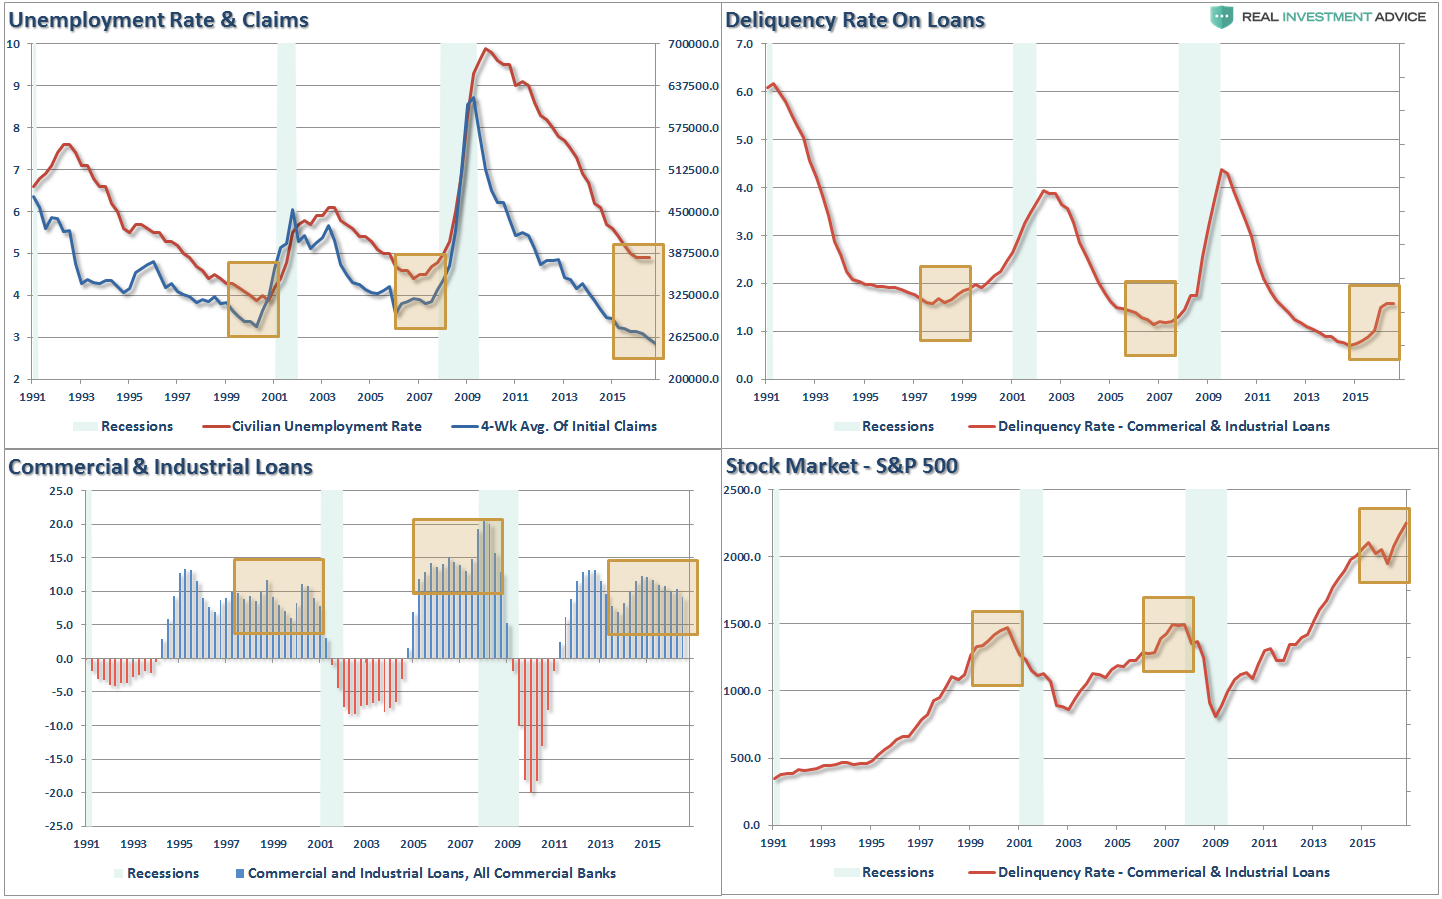
First, “record levels” of anything are records for a reason. It is where the point where previous limits were reached. Therefore, when a “record level” is reached it is NOT THE BEGINNING, but rather an indication of the MATURITY of a cycle. While the media has focused on employment, record stock market levels, etc. as a sign of an ongoing economic recovery, history suggests caution. The 4-panel chart below suggests that current levels should be a sign of caution rather than exuberance.
The point here for individuals trying to save for their retirement is that “getting back to even is not an investment strategy.” While the media continues to tout every advance to a previous level as the coming of the next great bull market – keep in mind that this has nothing to do with your money or investing. Bonds and cash have outperformed the stock market over the last two decades – yet individuals, chided along by the media and Wall Street, still chase the worst performing asset class over that time frame.
Let me turn this around.
As markets advance in price, the risk of investing money, or rather the potential for loss, grows. It is when markets decline that we should be getting excited about investing. Yet, it is exactly the opposite of how individuals react. The media should be hitting the airwaves on down market days with “The market got CHEAPER today as the S&P 500 declined…”
The reality is, however, that declining markets don’t sell products of mutual funds companies or Wall Street brokerage firms. Declining markets are not as fun as advancing markets, and investors just want to make money.
Unfortunately, it just isn’t that easy.
It is interesting that people spend years in school to become Doctors, Lawyers and Engineers but spend virtually no time studying and learning the most complicated game in the world – investing. Yet this is the game that they commit their hard-earned dollars to playing every day.
If you ask an individual if they would take their entire 401k plan and go to Vegas to gamble with it – they will look at you as if your crazy. That same individual, however, speculates with their retirement funds in a “virtual casino” every day with the hopes that somehow it will turn out to be a greater sum down the road.
Why? Because the media tells them that is what they must do.
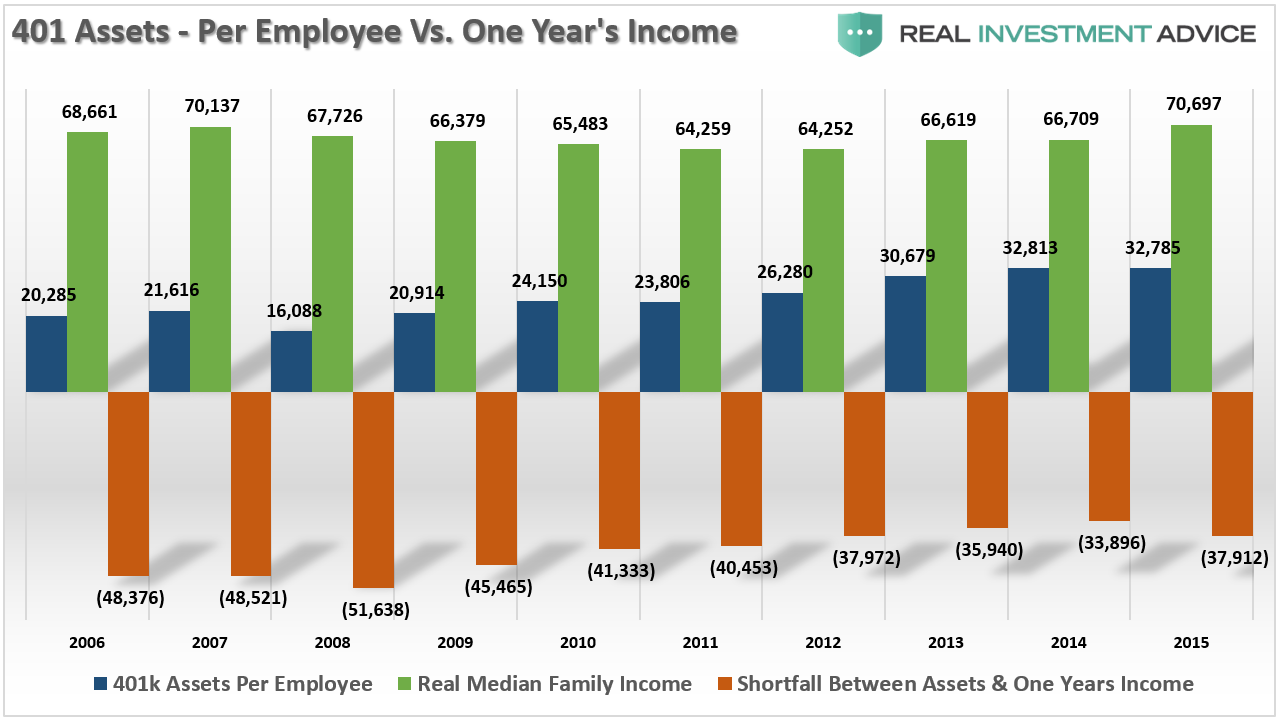
However, there is ample evidence they absolutely fail at doing so, which is also confirmed by the average retirement plan savings balance.
Since most investors lose money in the markets over time due to fees, emotional biases, trading mistakes, etc. – the odds in Vegas might be better.
To be a successful investor you have to be part historian, statistician, economist, financial analyst, and a fortune teller all rolled into one. Even with the requisite skills, education, and experience, investing for the long-term successfully is still a challenge in an environment where markets are inefficient, and to many degrees, affected by Central Bank influences.
Here is my point. With markets trading at extremes, bullish exuberance at peaks and monetary policy tightening – this might be a good time to locate one of those “greater fools” to sell to.
Of course, this is just the opposite of what the media is telling you to do.

