Wednesday April 12: Five things the markets are talking about
Despite safe haven flows remaining the prevalent market theme on geopolitical risks related to conflicts in Syria and saber rattling by North Korea, investors are shifting away from the worst of these levels as yen, U.S. Treasuries and gold erase their gains ahead of the U.S. open.
Note: Yesterday, the VIX had spiked to a two-week high, while U.S. 10’s tested a key long-term support of +2.30%, and the Nikkei was the worst performing major index on yen strength (both Nikkei and USD/JPY are at lowest levels since mid-Nov).
With limited fundamental data being released in the North American session, the market focus will be on the Bank of Canada’s (BoC) monetary policy announcement (10:00 am EST).
Dealer consensus expects the central bank to leave its benchmark interest rate unchanged (+0.5%), with Gov. Poloz expected to keep his focus on downside risks even though signs point to a Canadian economy that “maybe” coming to life.
Note: Many still argue that Canada’s economy is not as strong as the data would suggest, citing a recent setback in trade data and a household sector burdened with debt. Others argue that economic indicators, most notably job creation, point to an acceleration in growth.
1. Global equities produce mixed results
In Asia overnight, Japanese stocks fell to their lowest in more than four-months as rising geopolitical tensions in the region curbed risk appetite, with exporters badly hit as the safe-haven yen (¥109.35) spiked to a five-month high. The Nikkei 225 share average dropped -1.0%, while the broader Topix also fell -1%, led by declines in banks, autos and other exporters.
In Korea, the KOSPI rose +0.2%, after dropping -2% over the previous six-sessions. Down-under, Australia’s S&P/ASX 200 index gained less than +0.1%.
In Hong Kong, the Hang Seng China Enterprise (CEI) climbed +0.3% and the Hang Seng Index jumped +0.6%, wiping out earlier intraday losses.
In China, the Shanghai Composite fell -0.5% as data showed China’s producer price gains slowed in March from a peak in February, tempering the global inflation outlook (see below).
In Europe, equity indices are trading higher despite geopolitical tensions and the French Presidential election. Banking stocks are notably higher in the Eurostoxx, while mining stocks are trading lower in the FTSE 100.
U.S stocks are set to open in the black (+0.1%).
Indices: Stoxx50 +0.4% at 3,482, FTSE +0.4% at 7,396, DAX +0.4% at 12,183, CAC 40 +0.5% at 5,126, IBEX 35 +0.2% at 10,440, FTSE MIB +0.3% at 20,172, SMI +0.4% at 8,672, S&P 500 Futures +0.1%
2. Oil higher on compliance, gold atop five month high
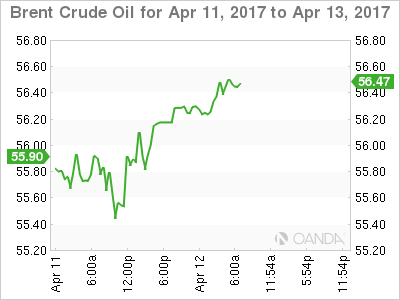
Oil prices have rallied overnight, putting crude futures on track for their longest winning streak in nine month, as Saudi Arabia is reported to be lobbying OPEC and non-OPEC members to extend last Nov. production cut beyond the H1, 2017.
Brent crude futures are up +20c, or +0.36% at +$56.43 per barrel, while U.S West Texas Intermediate (WTI) crude futures are up +18c, or +0.34%, at $53.58 a barrel.
While compliance from some participants has been patchy, the Saudi’s have made significant cuts, with production down -4.5% since late 2016, despite a slight increase in March to +9.98m bpd.
The oil ‘bear’ remains concerned that markets are bloated and oversupplied. Official U.S production and inventory data will be published later this morning (10:30 am EST).
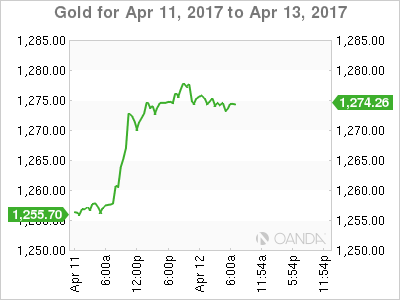
Political tensions and expectations of a cautious Fed (gradual rate rise) continue to support gold prices. After printing a nine-month high yesterday, the yellow metal has fallen -0.1% to +$1,273.70 an ounce ahead of the U.S open.
3. Global yield curves flatter
Uncertainty surrounding the French presidential election on April 23 continues to drive investors to sell French government bonds (OAT’s) and migrate cash into German government bonds and U.S. Treasury debt. The yield on French 10’s has backed up to +0.947%, while 10-year Bunds trade atop of their technically critical level of +0.2%.
Yesterday’s U.S Treasury +$20B 10-Year note reopening drew +2.332%. The bid-to-cover ratio was +2.48 vs. +2.66 prior. Indirect took +65.2% of competitive bids, with +26.4% were allotted at the high, while +5.3% go to direct bidders and +29.5% go to dealers.
The yield on U.S 10-year notes backed up +1 bps to +2.31%, erasing earlier declines. The rate dropped -7 bps on Tuesday.
Elsewhere, this morning Germany sold +€2.43B Feb. 2027 Bunds at an average yield of +0.21% vs. +0.41% on March 22. The bid-to-cover was +1.4 vs. +1.5.
4. Dollar pares losses, EUR contained, yen jumps
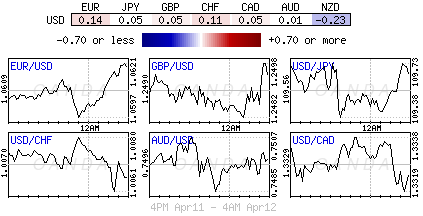
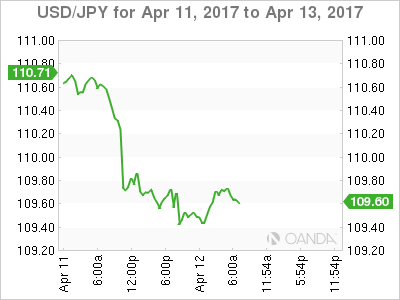
With safe haven flows remaining the prevalent FX theme, overnight price action saw yen (¥109.35) climb to its strongest level since mid-November before consolidating.
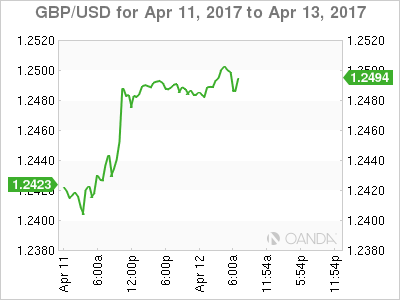
The pound (£1.2515) touched a one-week high ahead of this morning’s UK market data (see below). Thus far, GBP has been able to hold onto its gains as average wages (key focus of the BoE) beat expectations and saw higher back-month revisions.
Diminishing chances of a victory for far-right candidate Marine Le Pen in France’s presidential election is helping the EUR (€1.0604). However, expect that growing support for leftist candidate Jean-Luc Melenchon keeps alive French political concerns and tempers the ‘single’ unit’s gains.
Note: Volumes across the various asset classes are down in a week that’s shortened in many countries by Easter holidays.
5. China inflation soft, U.K wage growth slows
Data overnight showed China consumer inflation again remained “underwhelming” last month, as m/m CPI (-0.3% vs. -0.2%) fell for the second consecutive month in March and y/y was near its two-year lows below +1%.
Note: China’s official CPI target for 2017 is +3%.
Digging deeper, the food CPI component fell again by over -4%, while non-food rose slightly by +2.3% vs. +2.2% prior. Also, rising input costs continue to prop up wholesale inflation, with PPI up for the seventh straight month at +7.6% – close to consensus.
In the UK, average earnings after inflation in February for the first time in two and a half years, highlighting how rising prices fuelled by a weakened pound (£1.2500) are squeezing households’ spending power.
Average weekly earnings growth after inflation and excluding bonuses declined -0.4% on the month. Over the three months through February, earnings growth averaged +0.1%.
Note: Annual UK inflation is expected to exceed the BoE’s +2% target as a fall in the pound since June’s Brexit vote pushes up the cost of imports.
