Gold-price enthusiasts are wondering why the recent rally has suddenly lost its “mojo”. Some analysts worry about the VanEck Vectors Junior Gold Miners (NYSE:GDXJ) ETF portfolio rebalancing, and others are focused on the global stock markets rally.
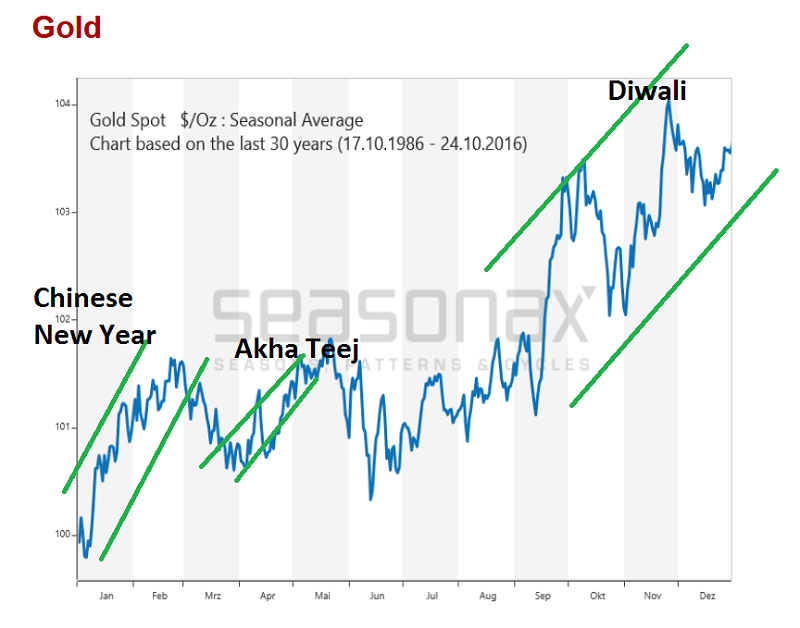
That’s a seasonal chart for gold, courtesy of Dimitri Speck. While the headlines are full of news on North Korea and US GDP numbers, the main price drivers for gold rallies are much more mundane and cyclical.
Indian and Chinese dealer buying for various love trade festivals is responsible for the three biggest annual gold price rallies, and dealer stocking for one of them (Akha Teej) is now essentially completed.
So, gold takes a breather. It’s that simple.
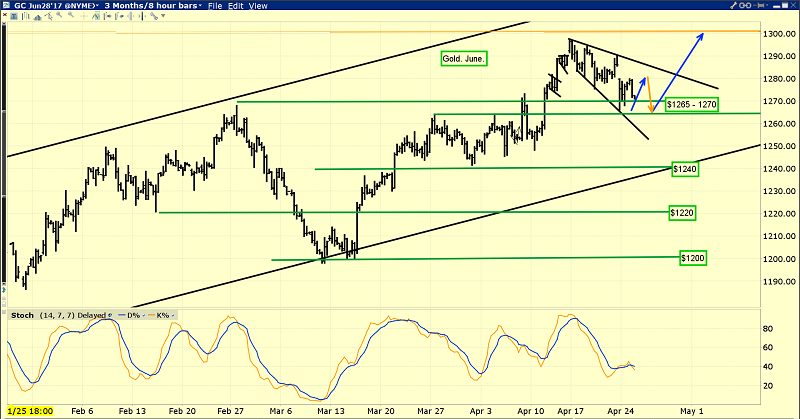
I suggested that gold would be a buy for gamblers at $1265 - $1270 and the price has just arrived there.
Conservative investors should wait to see if gold trades down to $1240 before buying, but gamblers can take immediate action. Regardless, gold is generally well-supported here, and there is no reason for any investor to be concerned about the big picture health of the market.
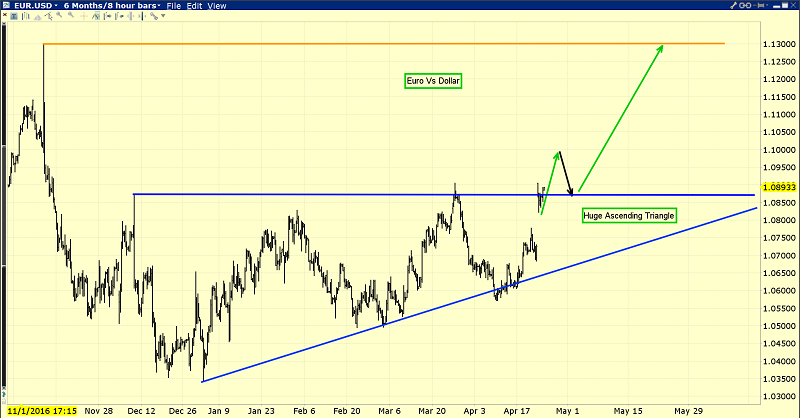
The French election voting showed “centrist” Macron doing well, and the euro has surged higher.
There is also a huge ascending triangle pattern in play on that euro chart. The target of that pattern is about 113. A rally in the euro toward that level could help gold challenge the $1300 area again, and in the short term it’s cushioning the gold-price decline.
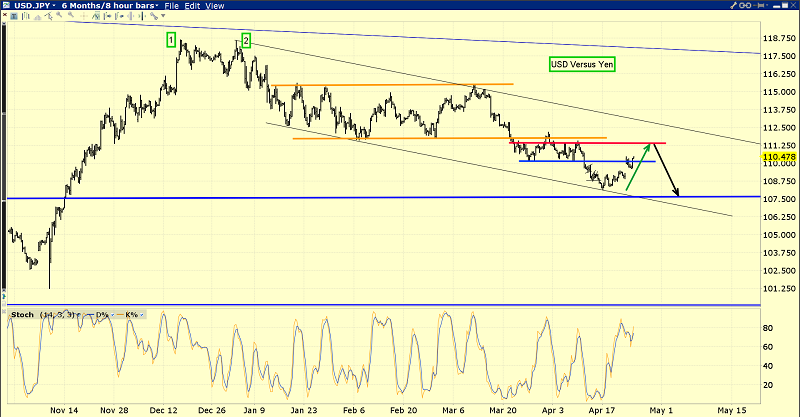
This is the dollar versus yen chart.
The French election news combined with positive statements made about US tax reform has triggered a big “risk-on” global stock market surge.
That’s reflected in the dollar-yen price action, and it has added a bit more pressure to gold in addition to that caused by the seasonal softening of Indian dealer demand.
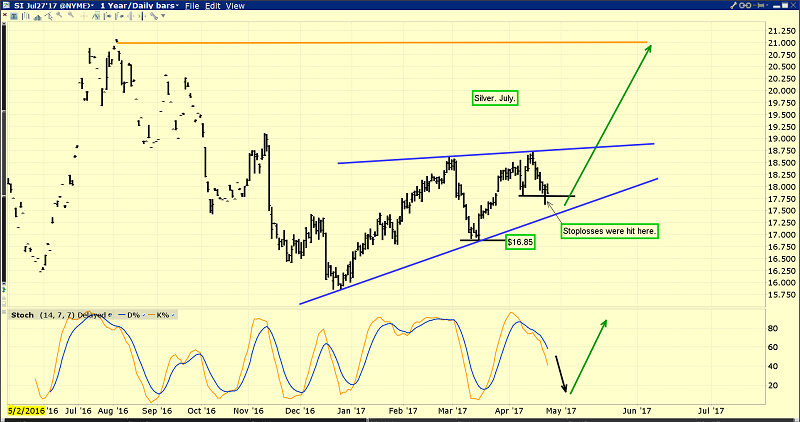
Silver bugs may be disappointed by the failure of the recent upside breakout, but a new and decent triangle is now in play.
A bit of patience is required. Gold and silver may drift sideways for now, but an imminent Fed rate hike is likely to start another rally, and that rally is likely to become a Diwali-fuelled barnburner.
The VanEck Vectors Junior Gold Miners (NYSE:GDXJ) rebalancing is just short term noise. The real upside action for gold stocks and silver stocks depends on a reversal in US money velocity.
For that to happen, more rate hikes are required to incentivize banks to take more risks and make more loans. That’s coming, but as I’ve noted, some patience is required.
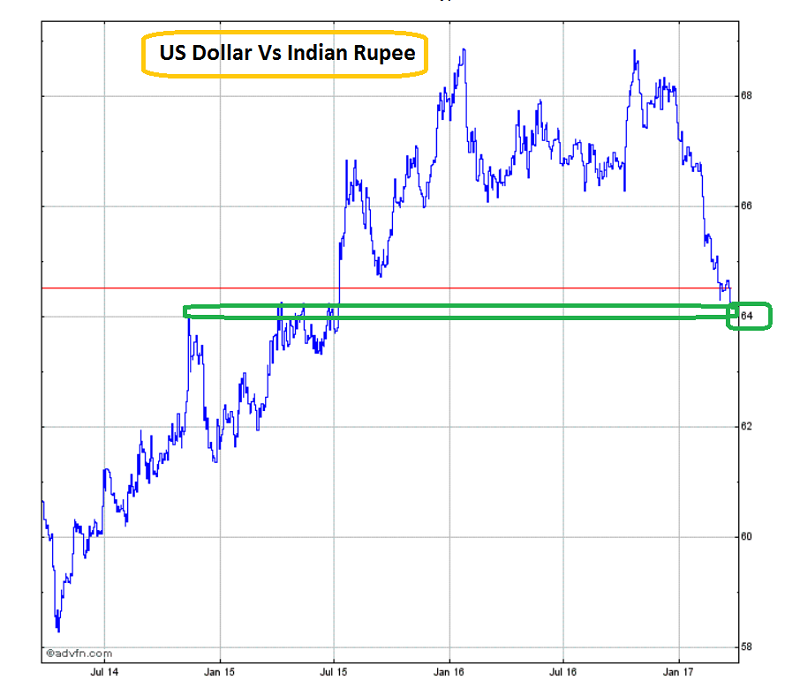
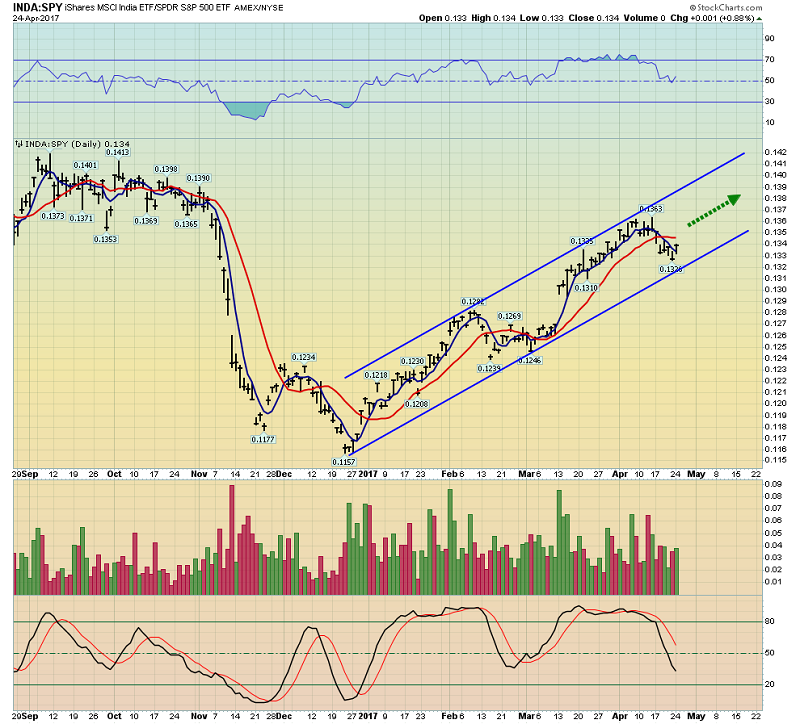
The dollar is almost in a state of freefall against the Indian rupee, and the Indian stock market is vastly outperforming its American counterpart.
That’s great news for gold demand, because a falling dollar makes gold cheaper to buy for Indians, and a rising stock market gives them more gold buying power. Having said that, most Indian buying takes place at times mandated by the Hindu religion, not by price changes in financial markets.
Still, patient precious metal investors can take comfort in the fact that gold and associated assets are very well supported now.
The SPDR fund tonnage has moved up to 860 tons in the face of recent price weakness, and that’s another very positive event.
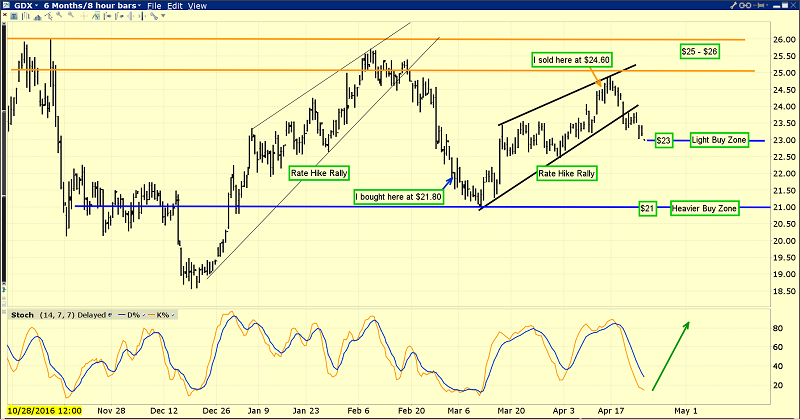
This is the VanEck Vectors Gold Miners (NYSE:GDX) chart.
GDX is now in a trading band. The lower end of the range is about $21, and the upper end is $25 - $26. The current pullback is good for light buying, and I am a very light buyer myself this morning.
If GDX pulls back even further in the coming months before there’s another Fed rate hike and record-size Diwali demand, gold stock enthusiasts should be very strong buyers in the pullback!
Stewart Thomson / 1276 Lakeview Drive / Oakville, Ontario L6H 2M8 Canada
Stewart Thomson is a retired Merrill Lynch broker. Stewart writes the Graceland Updates daily between 4am-7am. They are sent out around 8am-9am. The newsletter is attractively priced and the format is a unique numbered point form. Giving clarity of each point and saving valuable reading time.
Risks, Disclaimers, Legal
Stewart Thomson is no longer an investment advisor. The information provided by Stewart and Graceland Updates is for general information purposes only. Before taking any action on any investment, it is imperative that you consult with multiple properly licensed, experienced and qualified investment advisors and get numerous opinions before taking any action. Your minimum risk on any investment in the world is: 100% loss of all your money. You may be taking or preparing to take leveraged positions in investments and not know it, exposing yourself to unlimited risks. This is highly concerning if you are an investor in any derivatives products. There is an approx $700 trillion OTC Derivatives Iceberg with a tiny portion written off officially. The bottom line:
Are You Prepared?
