Friday December 16: Five things the markets are talking about
Investors are taking a breather from assimilating the probability of three-Fed rate hikes for 2017.
The ‘mighty’ dollar, ruling on rate differentials, has fallen back from its “dozen baker” highs against a plethora of currencies.
Given the likely higher than expected rate of monetary contraction next year, the U.S treasury curve continues to flatten, but at a slower pace. While dollar denominated commodities get a small reprieve.
The Fed’s pivot this week towards “hawkishness” marks a move away from central-bank policy dominating market sentiment. Investors will now focus on the potential for an increase in fiscal stimulus or Trumponomics.
1. Global equities deliver a tepid response on day-two after FOMC
Markets in Asia were mixed, with Japanese stocks touching a high for the year, even as stocks in Australia and Hong Kong posted modest declines.
Japan’s Nikkei buoyed by a weaker yen (¥118.00) rallied +0.7% to 19,401.15, its ninth day of gains the longest winning streak in 18-months. For the week, the benchmark index rose +2.1%, posting its sixth-weekly gains. Elsewhere, Australia’s ASX 200 ended -0.1% lower, Korea’s Kospi finished up +0.3% and Hong Kong’s Hang Seng Index closed down -0.2%.
In China, their stock markets managed to eke out small gains with the Shanghai Composite Index closing up +0.2% and the Shenzhen Composite Index at +1.0%.
In Europe, equity indices are trading mixed but generally consolidating near yesterday’s highs as market participants continue to digest the Fed’s recent policy decision.
U.S futures are set to open little changed.
Indices: Stoxx50 -0.3% at 3,242, FTSE flat at 6,998, DAX flat at 11,366, CAC 40 -0.2% at 4,809, IBEX 35 -0.4% at 9,307, FTSE MIB +0.6% at 19,112, SMI -0.1% at 8,203, S&P 500 Futures flat
2. Energy prices stable, gold gets a small reprieve
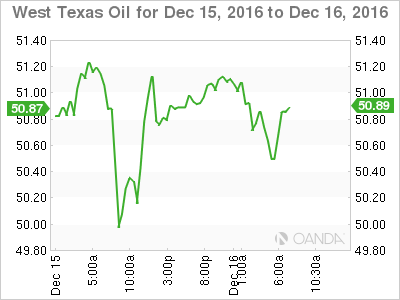
Oil prices are stable overnight as evidence increased that OPEC were informing customers of upcoming supply cuts as part of a their coordinated effort to combat a global glut concern.
Brent crude futures are trading flat at +$54.02 per barrel, while light crude (WTI) is down -2c at +$50.88 per barrel.
However, since any production cuts will only hit markets early next year and with Iraq is still raising sales to Asia, the price upside remains somewhat limited.
On the flip side, the decision by both OPEC and non-group members to cut production has likely put a floor on oil prices until such time as observance to the cuts can be assessed.
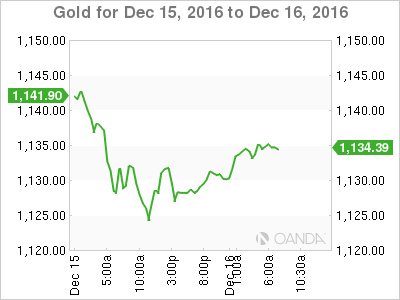
Gold prices have rallied overnight (+0.5% to +$1,134.18), but remain atop of their ten-month low ($1,122.35) as the potential for further Fed tightening dampens the safe-haven appeal of the ‘yellow’ metal.
3. U.S Yield curve flattens
Overnight, global yields seem content to give up some of yesterday’s premium. The yield on U.S. 10’s inched down to +2.559% from this week’s two-year high, while German bunds fell to +0.316% from +0.367%.
In contrast, the yield on 10-Year JGB’s rallied to +0.100% for the first time since Jan 29, the day the BoJ announced its negative-interest-rate policy (NIRP).
Elsewhere, Greece 10-Year yields fell to +7.295% from +7.428% after Greece’s central bank said the country must stick to its bailout commitments if it wanted to end a dispute holding back efforts to secure debt relief.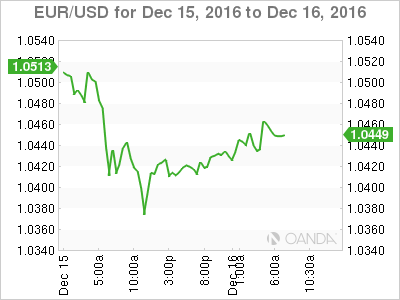
4. ‘Big’ dollar takes a breather
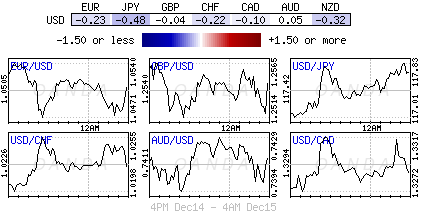
The USD seems content in consolidating its recent gains as treasury yields fall for first time in a week.
The dollar has been on a “one directional trade” since the election of Trump as U.S President, a five-week move supported by rate differentials.
This week the dollar managed to print its highest levels against the EUR in 14-years (€1.0375). It tested a six-year high against CHF ($1.0331) and a ten-month high against the yen (¥118.56) – the yen has fallen over -15% since the election last month passing the MXN ($20.3371) as the worst performing major currency in that period. A weaker yen continues to support the share prices of Japan’s exporters.
5. China jitters reappearing?
It seems that investor and dealer jitters are returning to the Chinese markets after months of stable trading and low volatility.
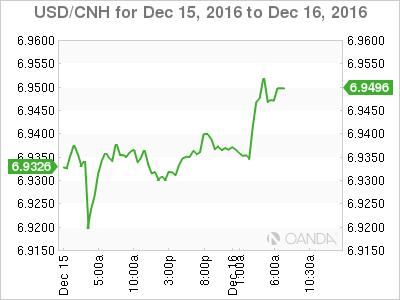
China authorities had to halt trading in some futures contracts overnight for the first time as a global bond-market selloff worsened. This persuaded a number of Chinese companies to cancel pending bond sales due to market volatility
According to the state-run Securities Daily, the PBoC has pumped approximately +¥600B over the past two-days to stabilize the bond and stock markets. Since last Monday’s stock market rout when the Shanghai Composite Index fell nearly -2.5%, the index has not closed up or below +1% which would suggest that authorities, for now, have a handle on the volatility.
This article is for general information purposes only. It is not investment advice or a solution to buy or sell securities. Opinions are the authors; not necessarily that of OANDA Corporation or any of its affiliates, subsidiaries, officers or directors. Leveraged trading is high risk and not suitable for all. You could lose all of your deposited funds.
