Jeffrey Gundlach predicts trouble for the equity, corporate and junk-bond markets if the yield on the 10-year Treasury bond goes above 3% in 2017. Even the housing market would suffer.
Gundlach is the founder and chief investment officer of Los Angeles-based DoubleLine Capital, a leading provider of fixed-income mutual funds and ETFs. He spoke to investors via a conference call on December 13. The focus of his talk was DoubleLine’s flagship Total Return Bond Fund (DBLTX).
Corporate bonds, as measured by the ETF LQD, have done poorly this year, returning -5.4%, but the junk-bond ETF JNK “massively” outperformed, returning 3.6% since the market bottom on July 8, Gundlach said. But he said if the 10-year bond, which closed at 2.46% on the day he spoke, goes above 3%, then junk bonds would “fall into a black hole of illiquidity.”
Investment-grade corporate bonds are already “as overvalued as it gets,” he said, and are threatened by excessive leverage in the corporate sectors.
A push above 3% would cause investors to rethink their equity holdings and shift allocations to bonds, he said. Financial services – specifically banks – would suffer because their dividend yields would be significantly less than 3%.
That rate increase would translate to a 30% increase in mortgage payments for homeowners from the July levels, according to Gundlach. This would hurt resales, he said, since there is “no way” the median income would rise by nearly 30%.
Gundlach said that “3% is a really big number on the 10-year. It won’t happen soon, but it may happen in 2017.”
“If you are above 3% on the 10-year, it is no longer possible to make the case that the bull market in bonds is intact,” he said, “at least based on the charts.”
Let’s look at Gundlach’s take on the market implications of the Trump presidency and his other comments.
Why Did Trump Win?
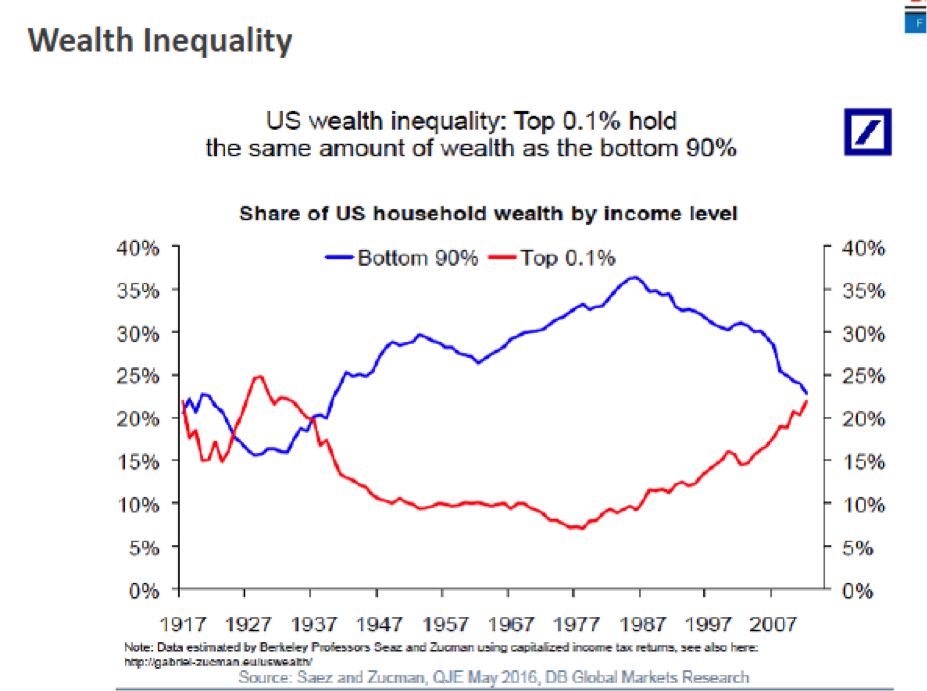
Gundlach, who predicted Trump’s victory starting in January, said that the election results could be summarized in this chart:
Over the last 30 years, the share of wealth for the bottom 90%, by income level, has gone from 35% to 22%, while the share for the top 0.1% went from 5% to the same 22%.
The bottom 90% have as much wealth as the top 0.1%.
Many voters in rural America are looking for Trump to fulfill his promise to “drain the swamp,” Gundlach said. He noted that phrase was originally used by Ronald Reagan, who also coined the slogan “make American great,” and it was Trump who added the word “again” at the end.
Gundlach compared the economy that Trump will inherit to what Reagan faced when he took office in 1982. In both cases, GDP growth was slow, but Reagan faced much higher inflation and bond yields. Stock market P/E ratios were in single digits for Reagan, but Trump will take office with a multiple of approximately 20.
By Robert Huebscher

