The Week Before
Last week, the United States formally embraced Donald Trump as president, although Trump’s new position spikes market uncertainty. The markets were relatively quiet on Friday, as Trump did not clarify in his speech how he will “Make America Great Again”. The USD lost gains during the week as investors were waiting on Trump to give USD pairs clear direction, which did not occur and leaves us to focus on what’s to happen next.
The Week Ahead
Fundamentals:
Euro: IFO Business Climate
Sterling: EU Membership Ruling, GDP figure
USD: GDP and Trump Day Meeting
Technical Analysis
In a previous article I shared an outlook for the USD January 2017 forecast, which is now proving true and here are your technical indicators on major pairs for January’s last trading week. The markets kick off in stealth mode awaiting a catalyst with most USD pairs ranging even volatile instruments such as gold, and has only moved by $11 with the precious metal having a negative correlation with the USD. One can always look at gold to determine the dollar’s future value. Gold has erased the greenback’s 2016 gains and is making a recovery, will USD shed more gains?
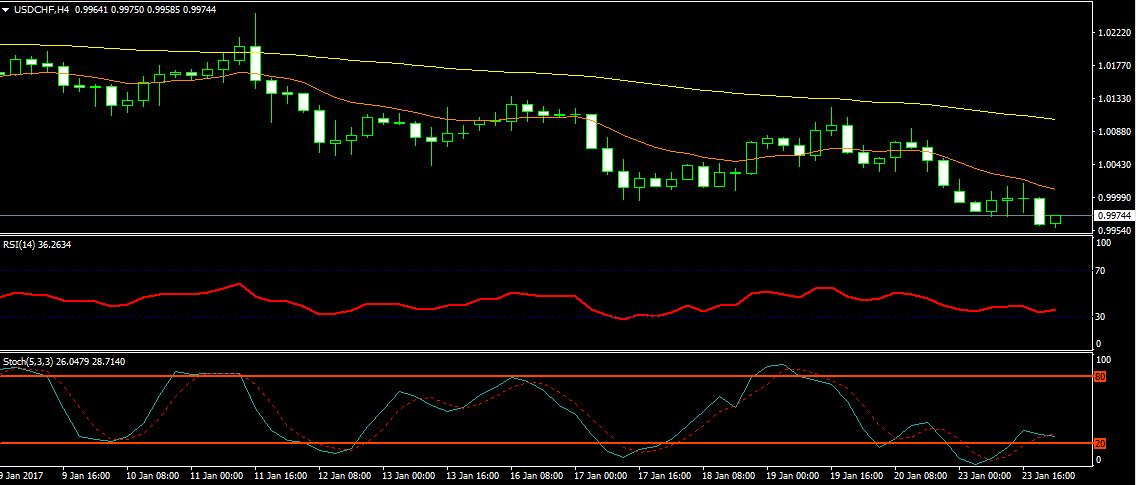
USD/CHF: The pair was hovering above daily support at 0.099 with an RSI at 36. which is 38.2 Fibonacci golden ratio and further downside can be seen should there be a break below 0.099. The pair is now looking to find support at 0.997 the pair has already broke below 1.001 50 Fibonacci golden ratio on the daily chart. Should the pair break below 0.099 possible targets lie at 0.994 and 0.972 in extension.
4hr Indicators
14 EMA – Orange
Relative Strength Index
Stochastic Oscillator
100 EMA - Yellow
Daily Indicators
Stochastic Oscillator
Relative Strength Index
Fibonacci Retracement
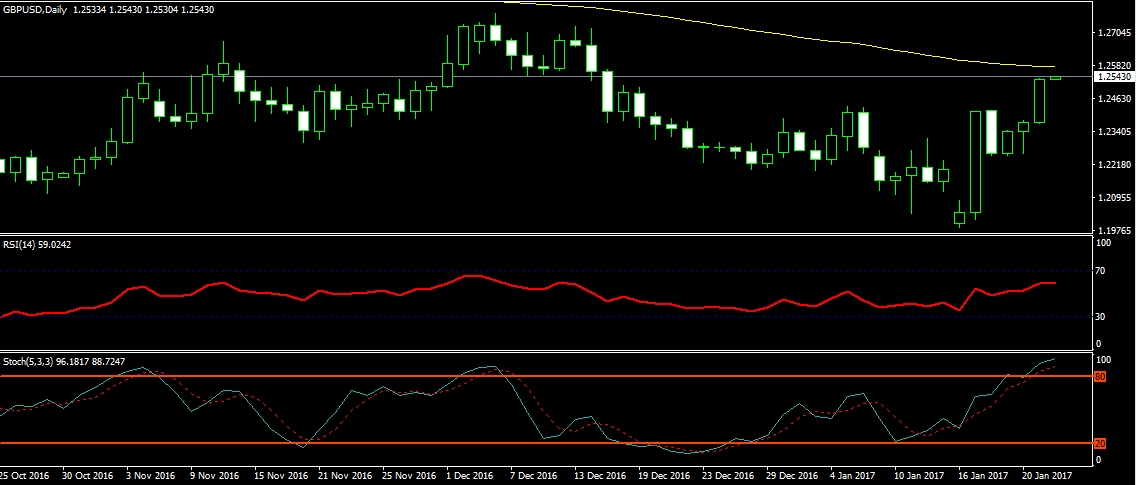
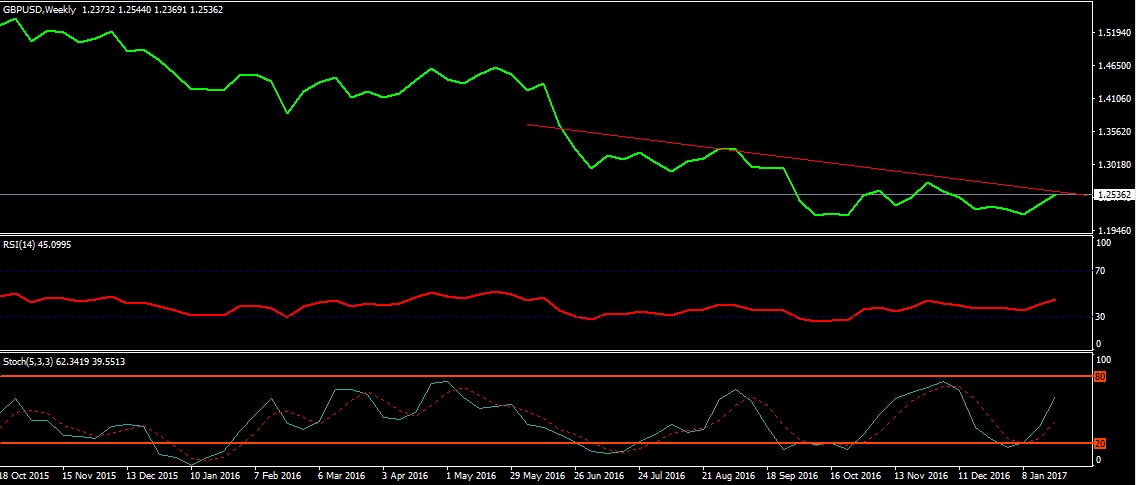
GBP/USD: Sterling has broken above daily resistance at 1.247 and has gained 60 pips now trading at 1.253 and it’s headed for the 100 DMA at 1.258 which is our prefered target. A break above 1.258 targets 1.27 and 1.279 in extension. GBP is threatening to break above weekly trendline resistance at 1.254 is a bull about to hit GBP/USD?
GBP/USD threatening to break weekly trend resistance
Weekly Indicators
Trendline
Relative Strength Index
Stochastic Oscillator
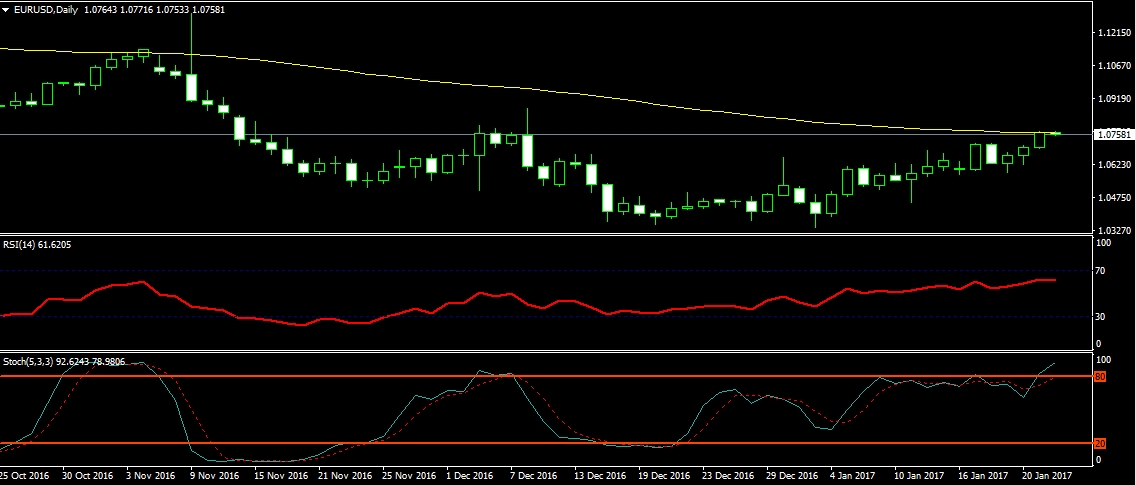
EUR/USD: As though the USD couldn’t be any nearer to a selloff we see yet another possiblity to go short on the USD. EUR/USD is trading right below 1.08 currently trading at 1.076 the pair is near breaking a strong resistance. A break above 1.08 targets 1.088.
EUR/USD trading towards 1.08 – 100 DMA
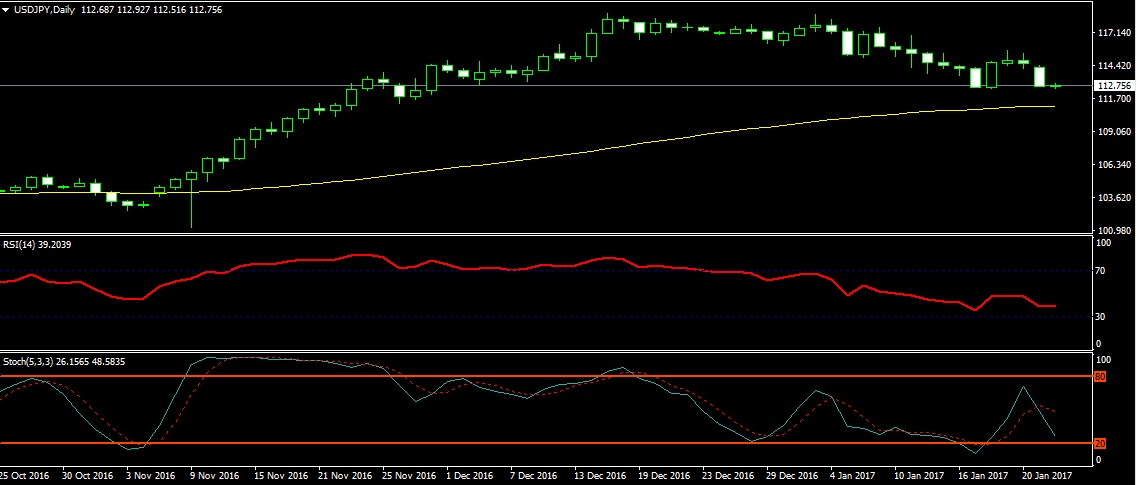
USD/JPY is hovering above daily support at 112.7 and a break below 112.7 targets the 100 DMA at 110.6 RSI is at 38 and room for further downside is evident.
USD/JPY trading towards 110.9 - 100 DMA support
Daily Indicators
100 DMA
Relative Strength Index
Stochastic Oscillator
What’s your view on the major pairs? Will the US dollar remain king or shall the global currency of exchange shed its gains?
Disclaimer: any views shared herein are that of the writer and although the analysis may prove true in most cases, past performance should not be used as reference for future performance.

