Slope of Hope vs. Reality: Greek Assets Hammered, 3-Year Yield Near 17%
Investors who plowed into Greek assets ahead of Mario Draghi's QE €60 billion a month bond-buying spree figuring the ECB could paper over this mess have been pounded almost nonstop recently.
Today alone, Greek bank shares plunged 22-29%, and yield on the Greece 3-Year Greek treasury hit 16.97%.
Worst Day in History for Greek Bank Shares
Bloomberg reports Greek Markets Hammered as Fears Grow Over New Government.
Greek bank shares suffered their worst one day loss on record on Wednesday, as anxiety grew over the new government’s plan to renegotiate Greece’s €240bn bailout.
The country’s four biggest lenders saw their stock prices plummet by an average of more than 25 per cent just two days after Alexis Tsipras, leader of leftwing party Syriza, was sworn in as prime minister. It was the third day of double-digit share slides for the banks.
In the space of a few hours, the yield on three-year Greek bonds jumped 2 percentage points to almost 17 per cent, as investors wondered whether Greece would honour its debts in the near term.
Shares in Piraeus, Greece’s largest bank by assets, whose stock price has halved over the past month, plunged 29 per cent. National Bank of Greece and Eurobank each fell 25 per cent and Alpha Bank 26 per cent.
Greek banks have been tapping the European Central Bank’s “emergency liquidity assistance” facility to replenish funds in the face of withdrawals by depositors and foreign banks’ reluctance to lend.
A few charts will confirm the above picture.
Greek 3-Year Bond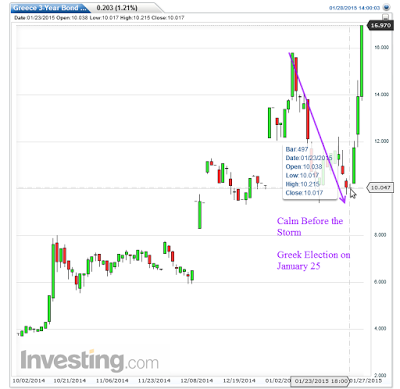
Greek 3-Month Bond Yield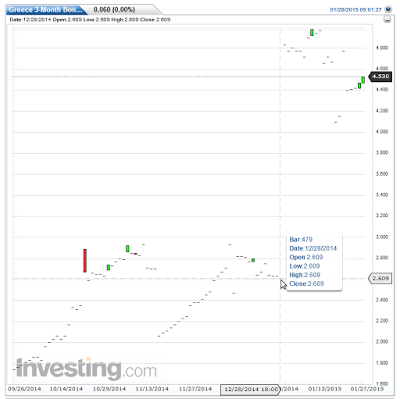
Greek Yield Curve
The yield curve may look strange to some, but here's the three-part explanation:
- Mid-range bonds will be hammered the most in any haircut deal.
- Yield on the 3-month bond spiked since the end of December.
- The market is pricing in the possibility of a default, but not within 3 months.
National Bank of Greece 15-Minute Chart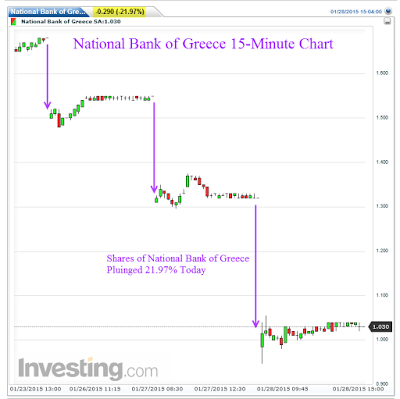
Shares of National Bank of Greece closed about 22% lower today. At one point they were down about 28%. Let's investigate the broader picture for this fine company.
National Bank of Greece Monthly Chart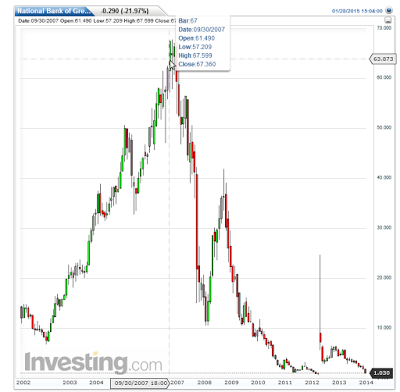
NBG has plunged from 67.60 in September of 2007 to 1.03 today. That's a plunge of 98.5%
FTSE Greece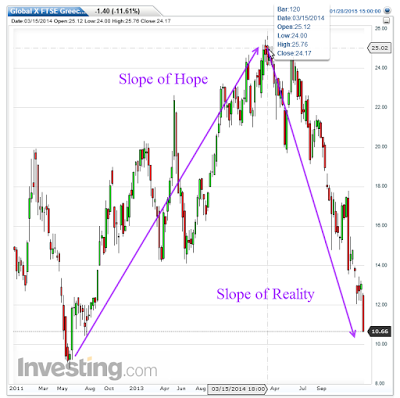
Slope of Hope vs. Slope of Reality
In June of 2012 the Greek-20 hit a low of 8.77. It hit a high of 25.76 in March of 2014. It was downhill from there, much faster than it went up. Today's decline was a modest 11.61%.
Run on the Banks
From Bloomberg (link above):
Deposits have declined by an estimated €12bn since December from a private-sector deposit base of about €164bn in November, according to Moody’s.
Those deposit declines looks like the start of a run on Greek banks. If so, it is necessary to get out before Greece imposes capital controls or the ECB shuts down the ELA (Emergency Liquidity Assistance) program for Greece.
