Have you seen the label "Made in USA"? Supposedly this means the product is "all or virtually all" made in the United States. I have little faith in labels such as this - the USA supply chain has gone from vertical (where one company literally made every piece of the final product) to almost horizontal (where the manufacturer is an assembler of outsourced components).
Follow up:
Without extremely tight supply chain controls found in aerospace and nuclear industry - few can prove the ultimate sub-subcomponent manufacturer in a court of law. Even in the 1970's, the amount of foreign made elements in components in goods made in the USA was surprising. No Dorothy, all countries trade - and items get all intermixed (the supply chain is just not geared to retaining source documentation, isolating batches, and continually passing it along). My point here is that if you buy an item from an American source - and it is not marked or labeled as "Made in Some-other-Country" - it is assumed you are buying a USA made product. The data to say otherwise does not exist.
In data gathering - many holes exist because the data is too hard or expensive to gather - or it is just better politically not to know.
So you might understand why I would be skeptical of: The Percentage Of Workers In Government Is At A 54-Year Low
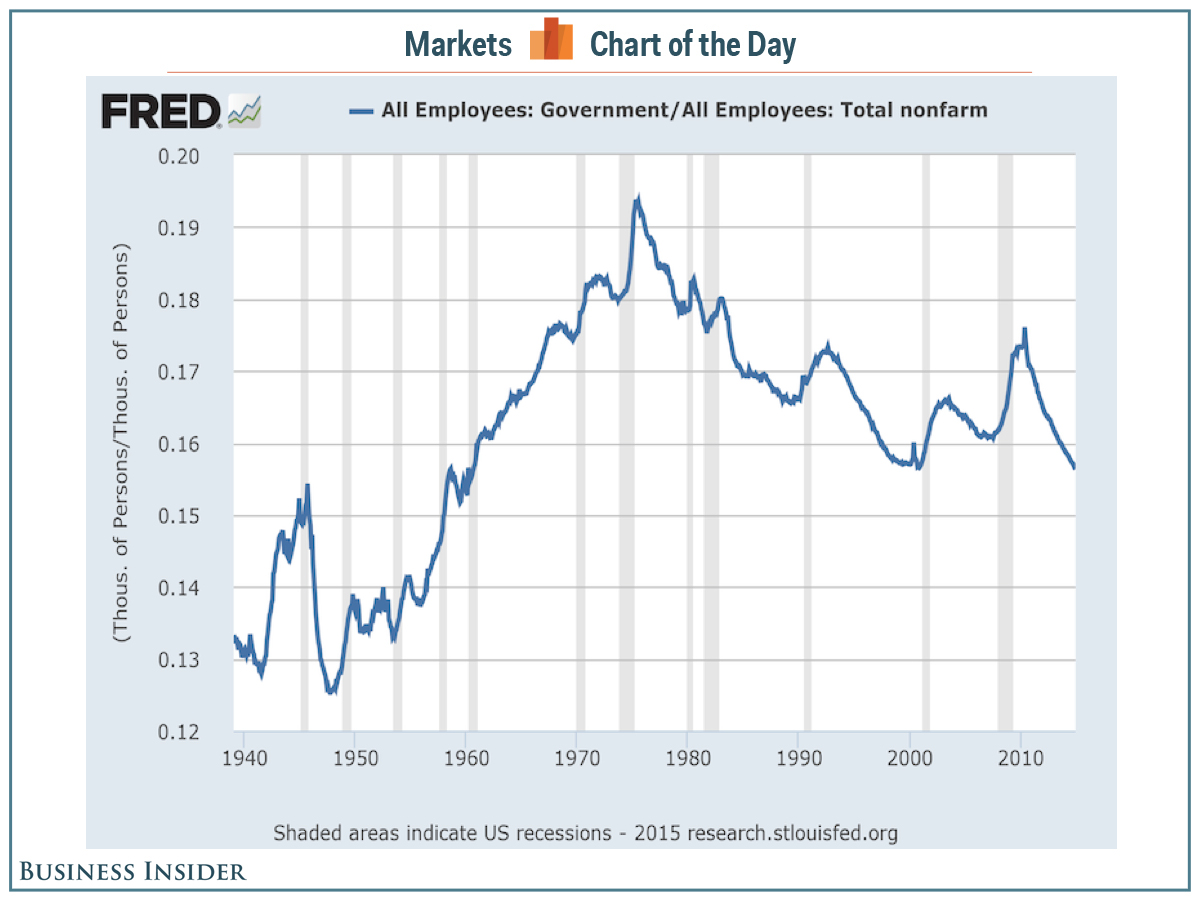
One of the things measured in the jobs report is the number of government workers. As has happened each month in 2014, there was a small uptick in government employment during December, with government adding about 12,000 jobs.
After a sharp drop following the Great Recession, the number of government employees bottomed out in 2013 and has been on a very slow upward trend since.
However, looking at government employees as a percentage of all employees shows a somewhat different picture ......
I 100% believe this data point, but I disagree with the implication that government employment is shrinking. Adding to this discussion, below find the graph of government employment (not percentage of workforce).
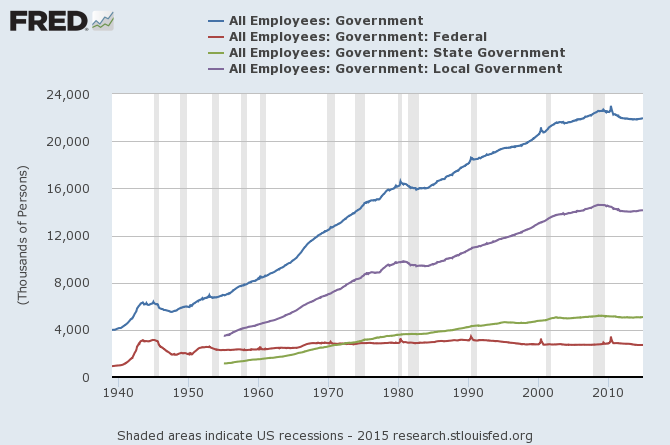
We KNOW that government employment is not growing as fast as private sector employment - what we do NOT KNOW is the size of the pool of private sector employees who are working under government contracts. They fall into several general groups:
- Contractors who are delivering a product to the government (such as an airplane or a missile);
- Contractors doing research and development under government grants;
- Contractors who literally operate as the arms and legs of the government (operate a government function).
As an example, in 2000 most of the top 10 government contractors according to usaspending.gov were providing goods to the Department of Defense. In f/y 2015 most contractors were managing a government operation. You can find articles here and there on the subject of the size of government contractor workforce. [hat tip to foreffectivegov.org for the graph below and their post on this subject].
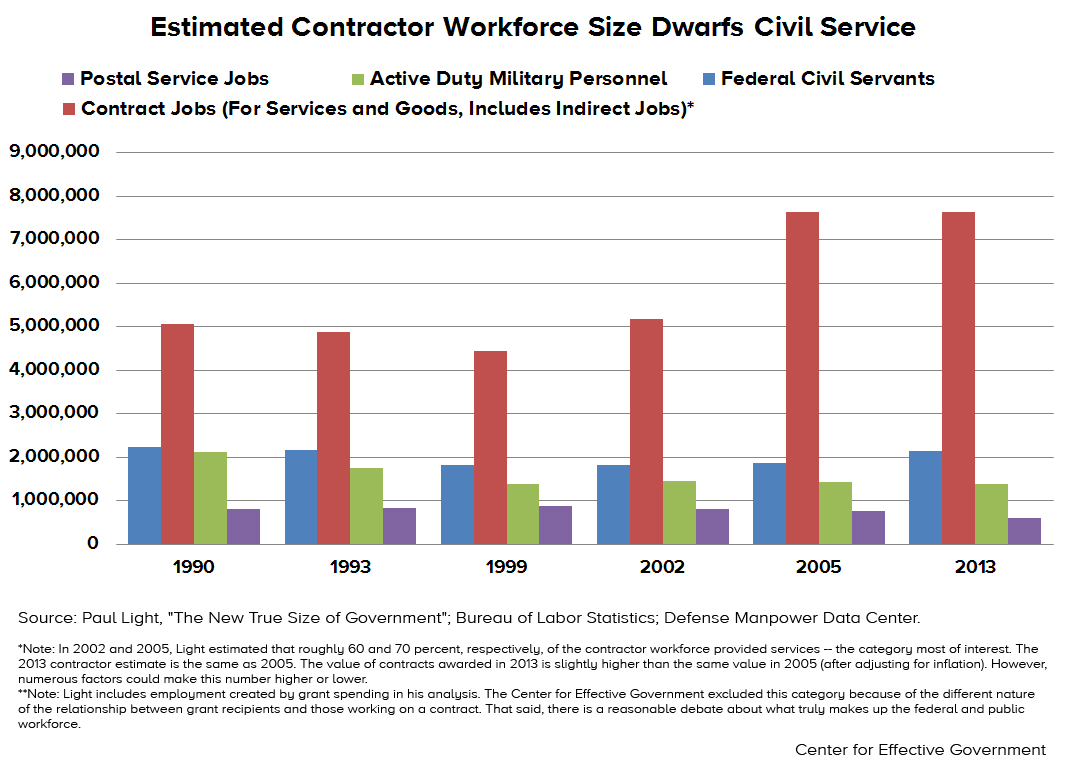
So why is this important. Frankly, investors can make no money if the government performs the services themselves. Government contractors who are the arms and legs of the government have a reliable income stream immune to the gyrations of the business cycle.
Neither political party in the USA wants to be fingered as increasing the size of government. So legislation tends to hide the manpower required for execution of new policy in the private sector. We are only guessing when one talks about the size of a government workforce - the data is not gathered so that there is any understanding about the number of private sector people working for the government sector.
Some claim the private sector is more productive. Some claim it is a way around unions. I am not suggesting that contracting government operations is bad - in fact I transformed city government in a far off land to a contract workforce. Having the ability to use both contract and direct hire workers make management sense for both government and private sectors.
There is no real data to prove the government directed workforce is declining. I would guess that the overall percentages are declining - but I would GUESS it is nothing dramatic or noteworthy.
Top 10 Contractors FY 2015 YTD
LOCKHEED MARTIN CORPORATION $2,268,079,908
MCKESSON CORPORATION $958,278,537 (health care)
THE BOEING COMPANY $842,558,040
URS CORPORATION $569,299,540 (management)
LOS ALAMOS NATIONAL SECURITY LLC $567,418,095 (bechtel management)
CONSOLIDATED NUCLEAR SECURITY LLC $492,807,707 (bechtel management)
BECHTEL GROUP INC. $466,792,751 (management)
MERCK & CO. INC. $377,752,343
LAWRENCE LIVERMORE NATIONAL SECURITY LLC $367,444,299 (bechtel management)
BATTELLE MEMORIAL INSTITUTE INC $353,028,508 (management)
Top 10 Contractors FY 2000
LOCKHEED MARTIN CORPORATION $17,050,067,372
THE BOEING COMPANY $8,417,254,909
NORTHROP GRUMMAN CORPORATION $5,542,044,820
GENERAL DYNAMICS CORPORATION $4,949,529,890
RAYTHEON COMPANY $4,522,919,447
STATE OF CALIFORNIA $3,206,115,247
BECHTEL GROUP INC. $2,733,049,315
BAE SYSTEMS PLC $2,427,182,360
SAIC INC. $2,294,112,262
MCDONNELL DOUGLAS CORPORATION $2,249,640,211
Government contractors, especially military equipment producers, are likely to be among the more defensive stocks for a portfolio. The government does not stop military contracts in a recession. For example in three of four down years for the broad market since 2000 Lockheed Martin (NYSE:LMT) was up when the S&P 500 was down.
In 2000, 2001, 2002 and 2008, LMT (without including dividends) had gains of 63%, 37%, 25% and - 22%. This clearly outperformed the S&P 500 index all four years: The broad market index had gains of - 15%, - 11%, - 23% and - 38%, respectively. But 2009, which saw another - 27% for both LMT and the S&P 500 in the first 10 weeks of the year, had the broad index outperform (+19%) while LMT was in the red (- 8%), both figures for the full year.
So perhaps government contractors are a place to evaluate stocks when looking for positions that might be good defensive holdings. Pardon the pun.
Other Economic News this Week:
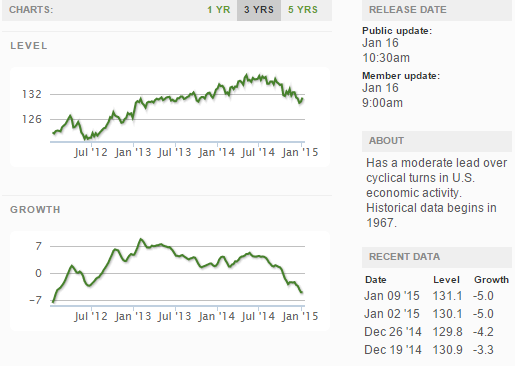
The Econintersect Economic Index for January 2015 is showing our index is midrange in a tight growth range for almost a year. Although there are no warning flags in the data which is used to compile our forecast, there also is no signs that the rate of economic growth will improve. Additionally there are no warning signs in other leading indices that the economy is stalling - EXCEPT ECRI's Weekly Leading Index which is slightly below the zero growth line. There have been some soft data points which caused our index to decline this month - but as the individual rolling averages are not declining, we must assume it is simply a bad data month.
The ECRI WLI growth index value crossed slightly into negative territory which implies the economy will not have grown six months from today.
Current ECRI WLI Growth Index
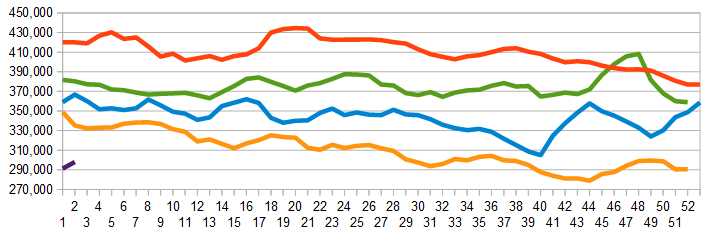
The market was expecting the weekly initial unemployment claims at 281,000 to 325,000 (consensus 295,000) vs the 316,000 reported. The more important (because of the volatility in the weekly reported claims and seasonality errors in adjusting the data) 4 week moving average moved from 291,250 (reported last week as 290,500) to 298,000. Rolling averages under 300,000 are excellent.
Weekly Initial Unemployment Claims - 4 Week Average - Seasonally Adjusted - 2011 (red line), 2012 (green line), 2013 (blue line), 2014 (orange line), 2015 (violet line)
Bankruptcies this Week: Caesars Entertainment Operating Company (CEOC) (aka Harrah's Operating Company), Privately-held Suntech America (aka Suntech Power)
Click here to view the scorecard table below with active hyperlinks
Weekly Economic Release Scorecard
