The GOP’s infighting weakens the dollar, boosting gold, whilst oil consolidates its recent gains.
OIL
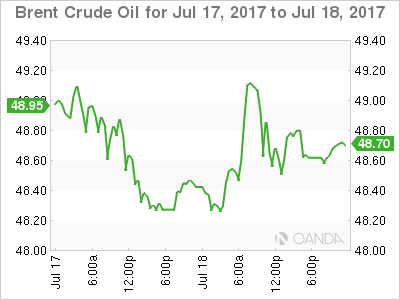
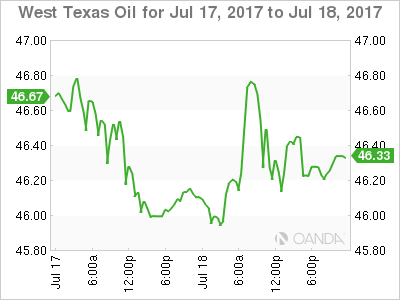
Oil flip flopped in a choppy one dollar range overnight with both Brent and WTI spot ending up almost unchanged for the New York session at 48.60 and 46.25 respectively. Crude rose initially on reports that the Saudis had further cut production and with the U.S. dollar being sent to the naughty corner in general. The rally petered out in New York’s afternoon. It mostly unwound after the American Petroleum Institutes, (API) inventory data came in at a disappointing +1.62 million barrels after last weeks goliath draw down.
The ranging nature of the past two days reflects our view that that positioning is now much more neutral in the oil futures markets. Having been so viciously whipsawed over the previous month, traders are tentative about holding strong views at these levels. More clarity may come tonight from the official U.S. Crude Inventories data where the street is looking for a -3.5 million barrel drawdown. A number less than this or even positive like the overnight API data may undo some of the good work in oil over the last week.
Brent spot trades at 48.60 this morning with support at 48.00 and resistance at 49.30.

WTI spot trades at 46.20 this morning with support at 45.75 and resistance at 47.20 followed by 48.00, the 100-day moving average.

GOLD
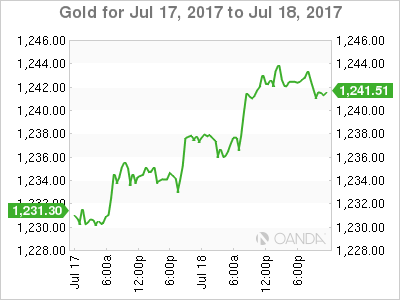
Gold continued its march higher overnight thanks to a confluence of positive factors. Gold rose from 1233.50 to close in New York 1242.70. Gold’s rise was sustained by a generally weaker dollar post a dovish Governor Yellen last week. The reassessment by the street of the U.S. interest rate outlook to more dovish has seen gold’s appeal as an asset markedly increase.
Political uncertainty is another factor that gold usually finds supportive, and Washington D.C. has been delivering it in spades. In this case, it has not been the rumours swirling around the President, but more the GOP’s failure to yet again raise enough votes to repeal Obamacare. This has thrown the entire legislative agenda into doubt. With the GOP’s inability to organise even a beer tasting in a brewery, let alone cross the road to the other side, investors have been deserting the Trump trade in droves, and this has been supportive of gold.
Gold is trading at 1241.00 in early Asia with some short term profiting taking seen initially. Resistance sits initially at 1245.00 followed by the 100-day moving average at 1247.50. A daily close above the latter being a bullish technical development. Initial support rests at 1240.00 followed by 1232.00 and then the 200-day moving average at 1230.40. It would probably take a daily close under the last level to make the street reassess its bullish view.

