Twenty-two radio interviews for the new book, 10 of them live.
At this point, my voice is tired. So are gold sellers.
Gold peaked at $1,934 in September of 2011 – the last major commodity to peak in the 30-year cycle that first peaked in mid-2008.
Silver peaked in late April 2011, after retesting its dramatic bubble peak in 1980, at $48. That’s when we gave our first and biggest sell signal for gold and silver.
After gold’s peak in September 2011, its first wave down ended up in a two-year-long trading range that vacillated between $1,525 and $1,800. During that time, I warned that when gold broke below that $1,525 level it was toast… and its major crash from $1,800 in late 2012 to $1,050 in late 2015 was indeed devastating.
Well, there’s likely another wave of that magnitude starting this year… As I’ve said all along, the next major target in gold is its 2008 low of around $700. To get technical with Elliott Wave Theory, that would retest the 4th-wave correction before the largest 5th-wave bubble run into $1,934. I still see gold landing somewhere between $650 and $750 in the next year or so, likely by the end of 2017.
But we’ll only see this after a significant bounce ahead…
At the beginning of 2016, I forecast that gold was very oversold. It was at $1,050 per ounce in late 2015 and so due for a major bear market rally back up to as high as $1,400. As I said it would, gold did bounce and got to $1,373 per ounce in early July 2016, at which point I recommended selling again. Lo and behold, gold fell rapidly to $1,124 in mid-December.
Gold is now very oversold again, but on a shorter-term basis, and its due for a minor rally to around $1,250. But given how oversold it has gotten, it could even go back to a slight new high near to $1,400. That could come by mid-February or so.
We’re currently betting against gold in our model Boom and Bust portfolio, and sitting pretty on that position. To project our profits while waiting for this mini-boom, Charles Sizemore, our Portfolio Manager, instructed subscribers to increase their stop loss in case this stronger rally ensues. But if it does get to near $1,400 again, that will be an even better time to bet against gold.
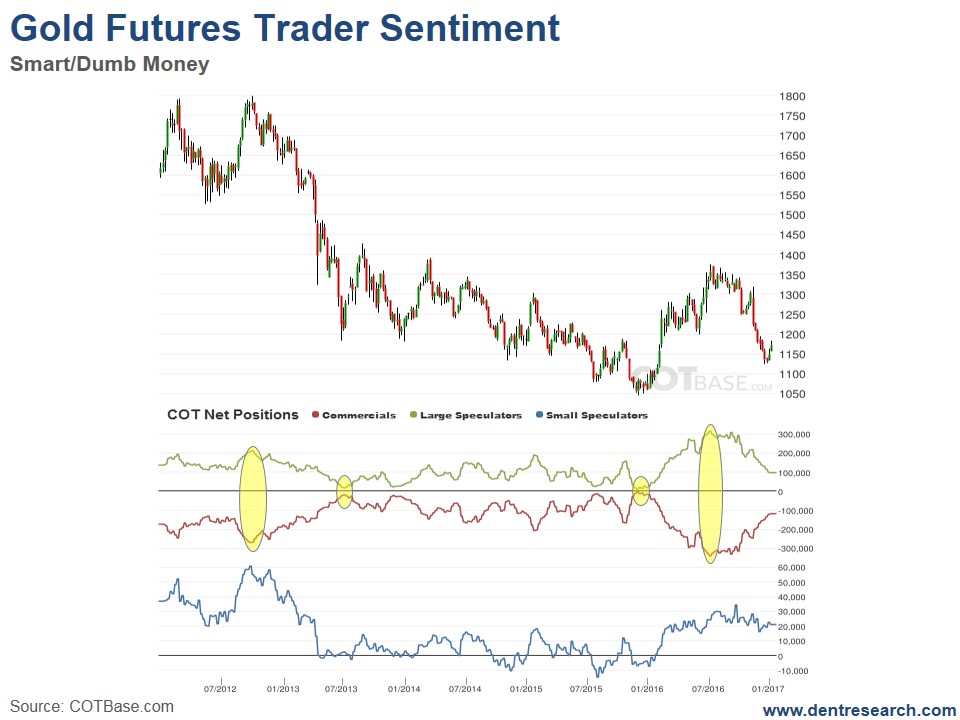
In the January Leading Edge issue, I’ll look at all major markets through the lens of the smart and dumb traders at the Commitment of Traders Report (www.cotbase.com). Of the commodities it looks at, gold has a bit more bounce potential ahead than oil and copper, but not likely for long. Here’s what that looks like…

The commercial hedgers are the smaller segment – the “smart money” – because they always go against the trends to hedge.
The large speculators are the “dumb money.” They simply follow the trends up and down and are always wrong at major tops and bottoms.
Gold hit a record divergence in dumb money net long at 320,000 and the smart money net short at 340,000… more so than even at the secondary top in late 2012 before the big crash into 2013-2015.
In other words, that was a bear market bounce, as I forecast at the beginning of 2016.
Gold then dropped 250 points into mid-December and is now bouncing again after being very oversold on a shorter-term basis.
The record divergence of July has not been erased yet. That would require going back to near neutral or slightly negative on this market. Currently the dumb money is still 100,000 long and the smart money 110,000 short.
That means there is much more to come on the downside after this short-term bounce resolves itself – again, likely by mid-February.
Silver had an even larger divergence a bit later into early August and looks to have even more downside potential.
My forecast of $700 gold and $10 silver is increasingly likely by the end of this year and almost certain in the next few years.
This rally will be the last chance for gold holdouts to get out!
The ultimate downside for gold at the bottom of the 30-year commodity cycle, between early 2020 and late 2022, is $400 or lower to erase the bubble that began accelerating in 2005. For silver those targets are as low as $5.
That’s when I would start to recommend buying gold and silver again longer term, with a target of $4,000-plus for gold by 2038-2040. The next 30-year commodity cycle could be the greatest ever seen because it will be driven by the demographically growing and still-urbanizing emerging world. They’re the ones who’ll be producing and consuming most of the gold and other commodities – especially India.
