Get 40% Off
⚠ Earnings Alert! Which stocks are poised to surge?
See the stocks on our ProPicks radar. These strategies gained 19.7% year-to-date.
Unlock full list

Gold’s Inflection Point

Published 01/18/2017, 11:11 AM
Updated 05/14/2017, 06:45 AM

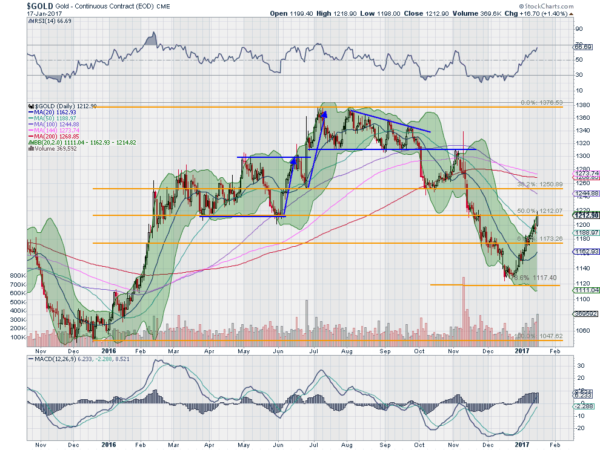
Gold had a great run higher off of a bottom in December 2015. It peaked 7 months later in July 2016 and over 30% higher. That period was followed by 3 months of consolidation before it turned back lower. The drop continued over the next 2 and a half months, finding a bottom in mid-December. At the bottom it had retraced almost 78.6% of the move higher.

Now it seems everyone is following gold higher again. The latest rally has been going for about 1 month, so far, and it has covered about $100. It has also recovered about 38.2% of the down leg from 2016. With that much of a ‘bounce’, it has to be a reversal that will last, right? Not so fast. While the move has been impressive, the price of gold now stands at an inflection point. There are 3 things for the long-term investor to watch before committing to a move higher.

Gold

Three Points To Watch

The first, of course, is continued price action to the upside. A solid push through 1212 is a good start. Breaking above the price level that was support in March and June at 50% of the initial leg higher is a big deal. It could take some time and that would be healthy too. With battles between buyers and sellers in February, March, June and November, there is clearly some investor opinion at this level.

The next thing to watch is the momentum. It has been running hot lately. The RSI is nearing a technically overbought condition and is above the peak where gold reversed lower in November. The MACD is still rising and is now positive. The former suggests that a pause or slowing of the move higher would be good for gold.

Finally, keep an eye on the 200-day SMA. Currently this arbiter of a bull/bear trend is about $50 higher. Gold's move higher in 2016 gathered stream as it pushed through the 200-day SMA in February, but it has not been above that line since it started the accelerated crash lower in November. A push above the 200-day SMA could be the icing on the cake.

Latest comments

Thx
Risk Disclosure: Trading in financial instruments and/or cryptocurrencies involves high risks including the risk of losing some, or all, of your investment amount, and may not be suitable for all investors. Prices of cryptocurrencies are extremely volatile and may be affected by external factors such as financial, regulatory or political events. Trading on margin increases the financial risks.
Before deciding to trade in financial instrument or cryptocurrencies you should be fully informed of the risks and costs associated with trading the financial markets, carefully consider your investment objectives, level of experience, and risk appetite, and seek professional advice where needed.
Fusion Media would like to remind you that the data contained in this website is not necessarily real-time nor accurate. The data and prices on the website are not necessarily provided by any market or exchange, but may be provided by market makers, and so prices may not be accurate and may differ from the actual price at any given market, meaning prices are indicative and not appropriate for trading purposes. Fusion Media and any provider of the data contained in this website will not accept liability for any loss or damage as a result of your trading, or your reliance on the information contained within this website.
It is prohibited to use, store, reproduce, display, modify, transmit or distribute the data contained in this website without the explicit prior written permission of Fusion Media and/or the data provider. All intellectual property rights are reserved by the providers and/or the exchange providing the data contained in this website.
Fusion Media may be compensated by the advertisers that appear on the website, based on your interaction with the advertisements or advertisers.
© 2007-2024 - Fusion Media Limited. All Rights Reserved.