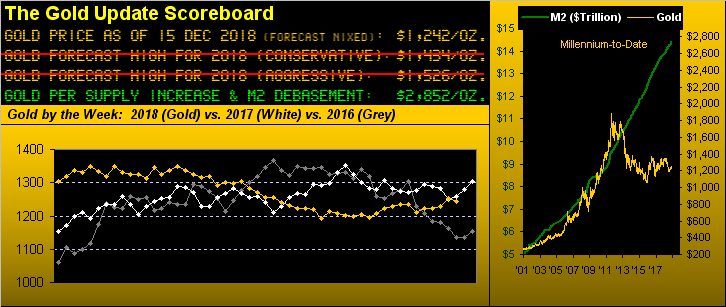
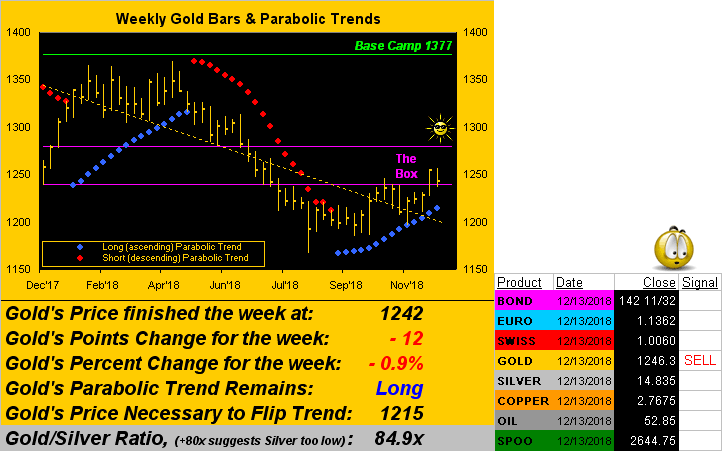
Gold: Ever since finding its way back up and nestling into The Box (1240-1280) these past two weeks, Gold's "rally" (schmoozing it as such) looks to have run out of puff, the tempting safety and serenity of The Box offering a place to pack it in for the wee balance of the trading year. As we've documented time-and-again, The Box has been such a common area in which to find Gold's price during recent years that 'tis almost as if 'tis therein fixed, (similarly as 'twas at $35/oz. until Nixon's nixing of the Gold Standard). "In other news, the price of Gold remains fixed at $The Box/oz." Or for those of you seeking precision whilst scoring at home, price settled yesterday (Friday) at 1242. That said, here's something that's "not supposed to happen": on 27 September Gold was 1186 whilst the Dollar Index was 94.59; the latter today is 96.91; (a gentle reminder that Gold plays no currency favourites). Moreover since that date, the US Money Supply (M2 basis) has increased from $14.26 trillion to $14.42 trillion. More Dollars and yet they're valued higher? "Got Gold?"
S&P: This past 20 September saw the S&P 500 close at its highest level ever: 2930; yesterday it closed at its lowest level since then: 2600; thus its widening correction-to-date is 12.5%. Regular readers know we're seeking the correction to ultimately run a full course of 27% (from the 22 September high print of 2940) to 2154 (a structural peak achieved just prior to the 2016 StateSide election), a level also at which ought then find the price/earnings ratio reasonably 'round 17x versus our "live" reading at present of 38x. (We shan't repeat such results' mathematical machinations made months ago). As for the timing nobody knows, albeit as herein noted a week ago, more bodies are jumping on the correction bandwagon. As usual, 'tis fun when earnings "beat estimates", but not so fun when earnings belie price, the Federal Reserve Bank raises rates, the Dollar further firms, the Economic Barometer keeps falling and tariff tart fights continue.
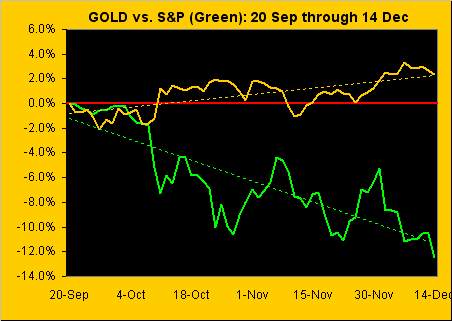
Les Deux: Thus for the like stretch as measured from 20 September, Gold today find itself 2.4% higher with the S&P 12.5% lower, the negative correlation being not so much quantitatively equal as (at least) 'tis directional:
'Course per the opening Gold Scoreboard wherein by Dollar debasement even as adjusted for the increasing supply of Gold, price today "ought be" 129% higher at 2852. Sick of hearing that? On 13 November 2008 Gold settled at 705; 677 trading days hence on 25 July 2011 it settled at 1615, i.e. 129% higher. That is certainly more promising than what this next chart suggests for the S&P.
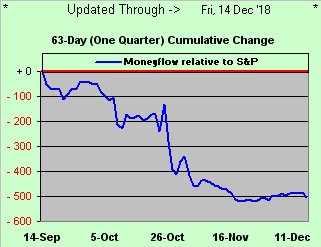
By regressing the S&P's moneyflow into points, the blue line below "suggests" the difference in points of where the S&P "ought be" -- i.e. 500 points lower -- than it presently is as measured from three months ago-to-date; (this is updated daily on the website). "Sick" indeed:
Speaking of sick, we've also the Economic Barometer: ouch! And November metrics which arrived this past week didn't help: Core prices of both exports and imports fell whilst both wholesale and retail inflation slowed to nearly a halt; the pace of Retail Sales growth dropped from 1.1% in October to 0.2% as the latter month's Business Inventories bloated. Hide, but peek, if you dare:
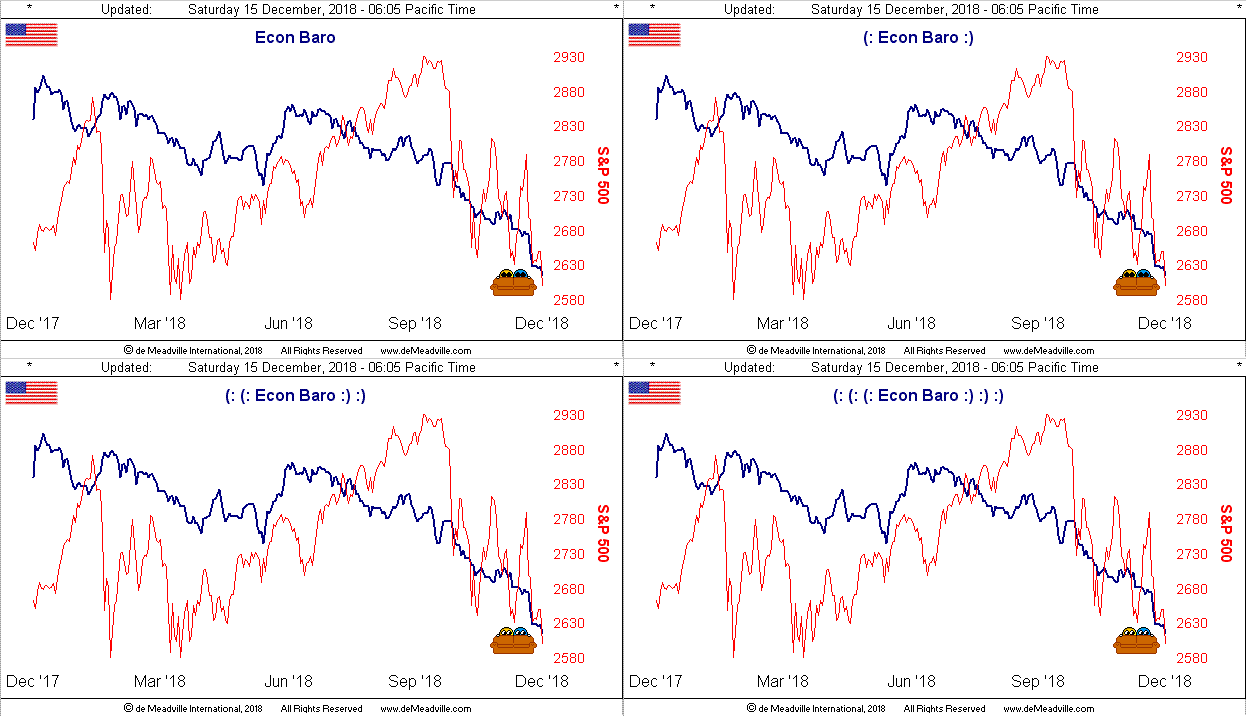
And that's just Stateside. Over in China, output from factories fell to almost a three-year low, whilst sales at the consumer level reached a 15-year low. More universally, the International Monetary Fund’s First Deputy Managing Director David Lipton sees "...storm clouds building..." and that "...We should not expect governments to end up with the ample space to respond to a downturn that they had ten years ago...". Add to it all France losing its business attractiveness, UK's May barely bumbling about for Brexit, and the Central Bank of India Governor Urjit Patel's having just resigned, and we again ask: "Got Gold?"
For which we next turn to its weekly bars along with a right-side panel. As you've been following, the bars themselves obviously have found their way back up into the purple-bounded box, Gold perhaps "hanging it up" in there for the rest of year in search of resting beneath some sun for the holidays. But the Scrooge in it all can be seen in the panel at right. The end of each trading day pops up with that little vignette listing the BEGOS Markets. Note that next to Gold is the word "Sell" as we'll next explain:
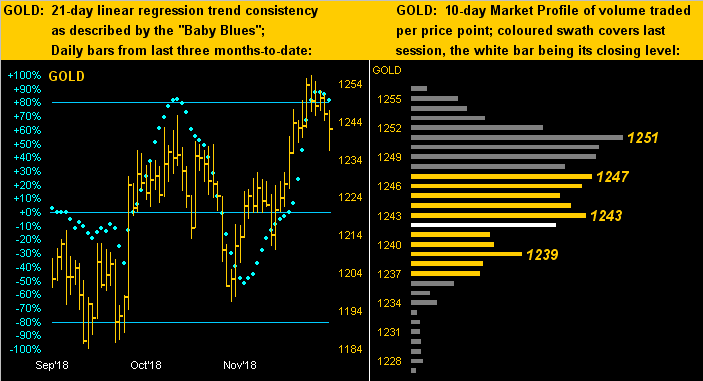
In concert with this missive's title that "Gold's Rally Abates" comes the word "sell" in that above cell. 'Twas triggered this past Thursday per what we now see in this next two-panel chart, wherein on the left across Gold's daily bars from three months ago-to-date the baby blue dots of linear regression trend consistency have begun to kink down. When they so do -- especially from above the +80% axis which generated the word "sell" -- lower prices generally ensue. Specific to this case: given all that's going wrong 'round the world, our lean is that Gold shall instead cling to our so-called "safety and serenity" of The Box (1240-1280). Still, 'twould be insincere not to point out the "sell" alert. And per the 10-day Market Profile on the right, there's really not much near-term pricing support sub-1239:
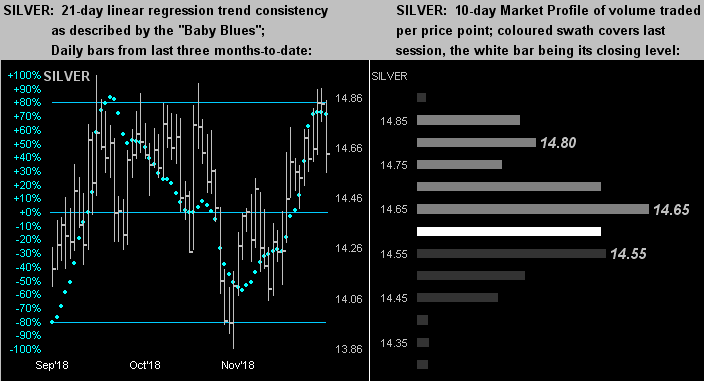
Lest she not be left behind, here next is the like graphic for Sister Silver, the analysis for whom is quite similar, albeit her "Baby Blues" haven't quite exceeded the +80% axis. 'Course, the story here remains the overwhelming high Gold/Silver ratio of 84.9x, which were it in line with the millennium-to-date average of 63.8x would put price today at 19.47 rather than the present 14.64.
"That's a +33% arbitrage advantage, mmb..."
One might observe as so, Squire; (the lad's furthering his usage of multi-syllabics leaves us nearly speechless). Leaving nothing for granted, here are Silver's bars at left and Profile at right:
Toward this week's wrap, let' go with the Stack:
The Gold Stack
Gold's Value per Dollar Debasement, (from our opening "Scoreboard"): 2852
Gold’s All-Time High: 1923 (06 September 2011)
The Gateway to 2000: 1900+
Gold’s All-Time Closing High: 1900 (22 August 2011)
The Final Frontier: 1800-1900
The Northern Front: 1750-1800
On Maneuvers: 1579-1750
The Floor: 1466-1579
Le Sous-sol: Sub-1466
Base Camp: 1377
2018's High: 1369 (11 April)
The 1360s Double-Top: (1362 in Sep '17 and 1369 in Apr '18)
Neverland: The Whiny 1290s
The 300-Day Moving Average: 1273 and falling
10-Session directional range: up to 1257 (from 1227) = +32 points or +2.4%
10-Session “volume-weighted” average price magnet: 1246
Trading Resistance: 1243 / 1247 / 1251
Gold Currently: 1242, (expected daily trading range ["EDTR"]: 10 points)
The Box: 1240-1280
Trading Support: 1239
The Weekly Parabolic Price to flip Short: 1215
2018's Low: 1167 (16 August)
So here comes "Fed Week". Given the bank's present Funds rate of 2.250%, but the market's settling yesterday at 2.425%, the Federal Open Market Committee members are doubtless revved up and ready to raise, then off to hide in the Christmas haze. And yet, the week also brings 16 metrics for further Econ Baro daze. So hang onto your Gold as one day 'twill amaze!