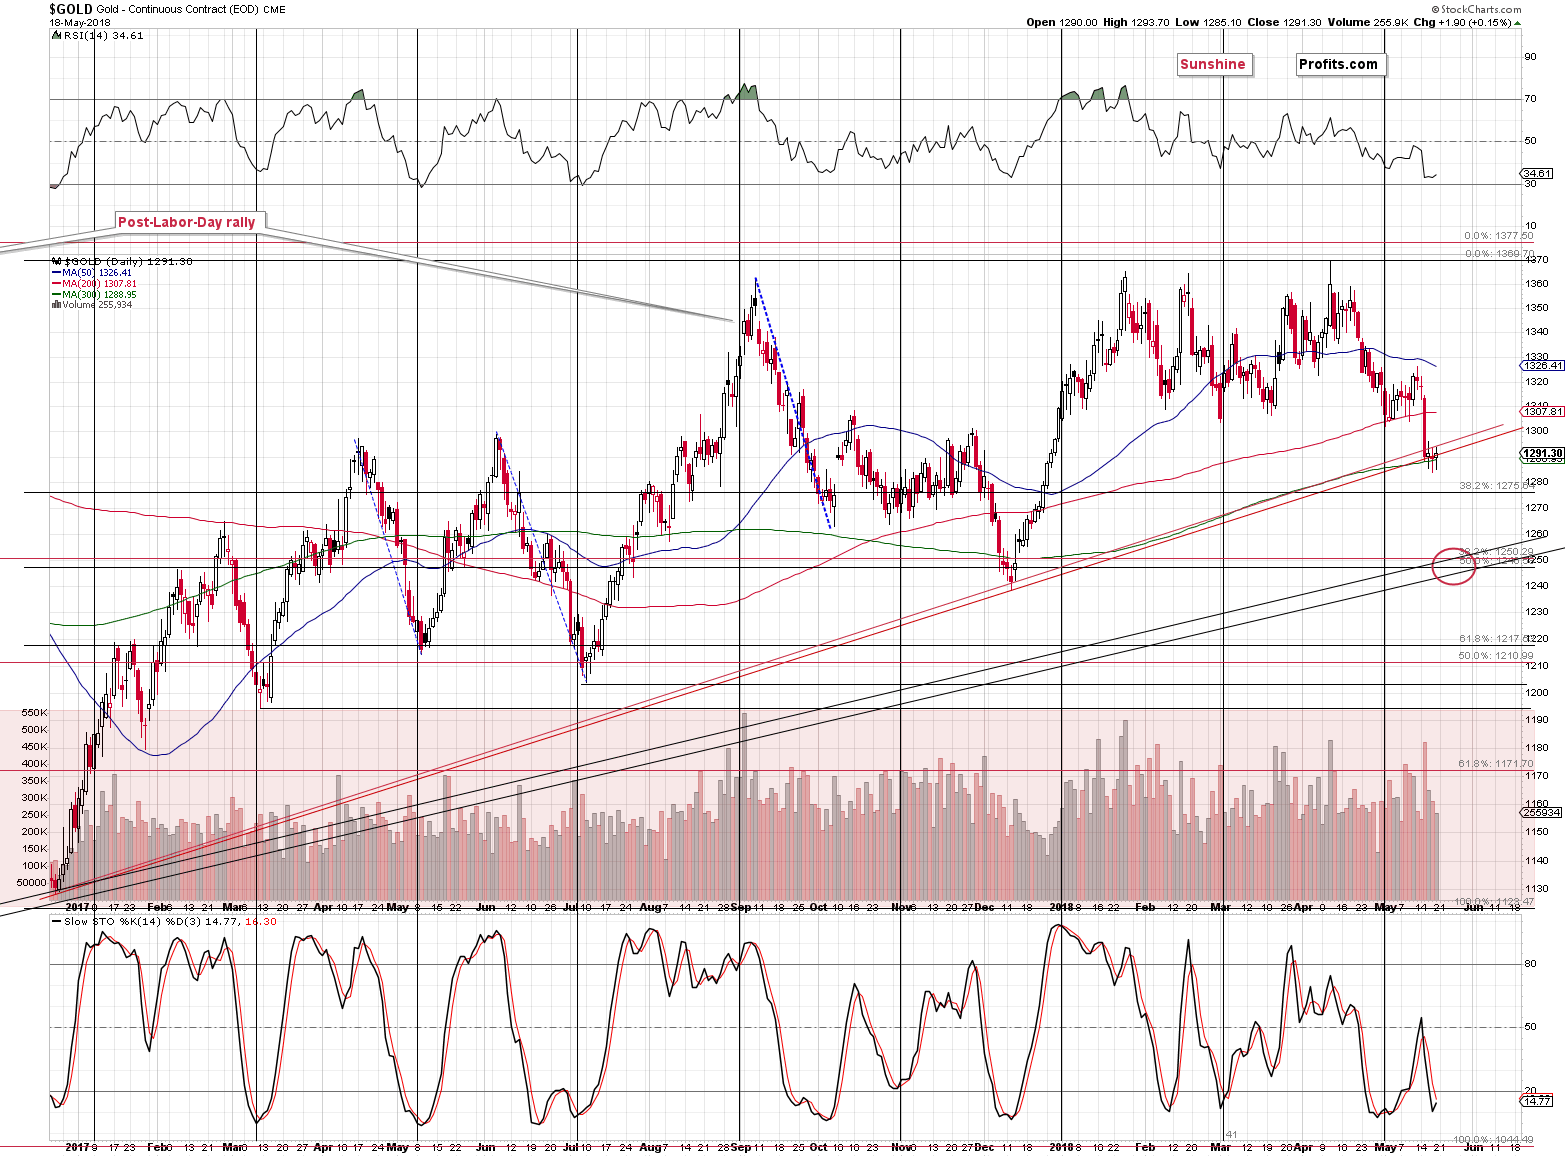
The price of gold moved considerably lower in the past several weeks, despite the pause that we saw in the final part of the previous week. The yellow metal moved below $1,300 and confirmed this move by several daily closes below it. Moreover, gold confirmed the breakdown below the rising medium-term support line that’s based on the daily closing prices of December 2016 and December 2017 lows. Consequently, gold’s likely to move lower and the question is how low can gold decline in the near term.
Before providing our reply, we’d like to emphasize that this is what seems most likely at this time, but we are not discarding other possibilities. It’s more important to stay flexible when the new developments emerge than to stick to the original gold price prediction – and we will.

Gold Is Likely To Move To $1,250
There was no meaningful correction from the currently-tested rising support line, which makes it more likely that the next strong support will indeed manage to generate one. After all, no market can move up or down without periodic corrections.
Why $1,250? Because of several reasons:
- Long-term support line based on the December 2015 and December 2016 highs. When based on the closing prices, this line is a bit above $1,250, and when based on the intraday lows, this line is a bit below $1,250. Consequently, it seems likely that we’ll see a move below $1,250 on an intraday basis, but a close back above it. This intraday prediction is not very precise, yet that’s an outcome that appears more likely than other events.
- The 38.2% Fibonacci retracement level based on the 2015 – 2016 rally is at $1,250.
- The 50% Fibonacci retracement level based on the 2016 – 2018 rally is just a few dollars below $1,250.
- The previous short-term decline ended a few dollars below $1,250 in December 2017.
- The RSI indicator is at 33, and a move below 30 corresponded to local bottoms many times in the past. A move to $1,250 seems to be enough to make the RSI move below 30.
- The current situation is similar to what happened in early October 2016, when gold moved lower after topping for several months and forming many local tops. Gold has been topping most of this year, forming many local tops. In both 2016 and 2018 gold topped close to $1,370 and the initial local bottoms were formed a bit above $1,300. When gold finally broke below $1,300, it bounced only after reaching $1,250. Interestingly, it moved below this level on an intraday basis and closed the session back above it, just like the support lines (Point 1) are currently suggesting.
Summing up, gold is likely to move considerably lower this year, but since no asset can move up or down in a straight line without periodic corrections, we’ll most likely see the latter in gold along the way and the nearest corrective upswing is likely to start from about $1,250. Whether a move from this level it is going to be tradable or not is not clear at this time, but we will most likely get additional confirmations once we get closer and we’ll discuss them in the upcoming Alerts.
Please note that the above is based on the data that was available when this essay was published, and we might change our views on the market in the following weeks.
Thank you.
