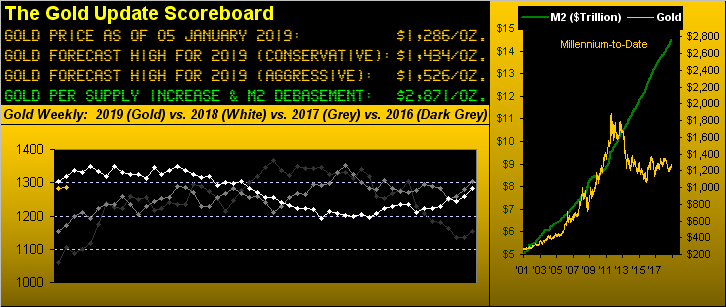
In a nutshell for those of you who've been gallivanting about in mirthful holiday mode, we concluded that since gold hadn't altered any of its overhead pricing structure in not having traded far enough upward as to so do, nothing has thus changed such that the forecast remains rightly the same. Indeed the only advance is that ever-telling number in green which at this date a year ago was $2,777/oz. and which today is $2,871/oz. That is because the M2 supply of made-up dollars is today $706 billion more than 'twas then. Yet the price of gold one year ago was higher (albeit immaterially so) at $1,320/oz. versus its having settled out the week yesterday (Friday) at $1,286/oz.
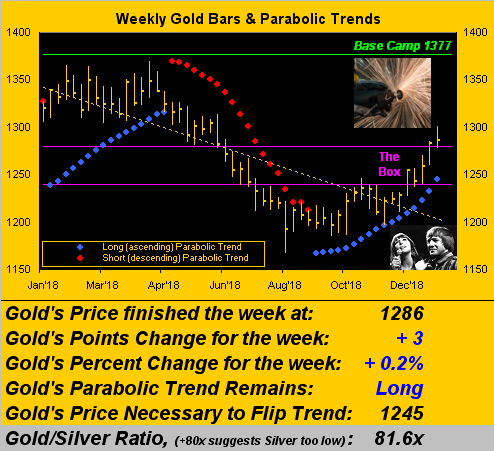
Yes, the beat goes on in gold's weekly bars for its rising blue dots of parabolic Long trend. Of the 38 such Long trends millennium-to-date, this current one now of 17 weeks ties for seventh in duration, but pales in comparison by price sweep: its seventh-place cohort (for the 17 weeks ending 13 May 2016) encompassed a low-to-high run of +20.7% (from 1082 to 1306); this run is not even half that at +9.8% (from 1184 to 1300). Up is up and as we on occasion say "we'll take that which we can get".
Gold today is right where it was those two-and-a-half years ago. Traders' delight, investors' plight. Still 'tis nice to see price above The Box (1240-1280); however that left-most thicket of bars in this weekly chart shall require diamond-tipped drill bits through which to get. 'Course, the ongoing correction in the "lurch-about S&P 500" ultimately down to 2154 ought to continue playing into Gold's favour ... and a re-taking of Base Camp 1377 we'd certainly savour. The technical wet blanket on it all? The diagonal dashed trendline is still in descent and price is stretched quite far above it. So "c'mon common sense fundamentals!" Help save the day:
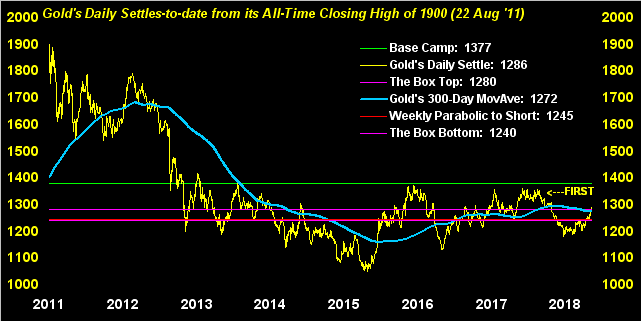
That said, per this next chart of gold's daily closes since the highest ever, the price has regained the 300-day moving average, barely back above it for the first time in nearly seven months. Again to the left of present price is that aforementioned thicket up through which to drill just to reach Base Camp 1377, (the green line in the chart); such achievement would then herald our "conservative" forecast high for this year of 1434. However, from the "First Things First Dept." getting through said thicket stands as a massive "FIRST":
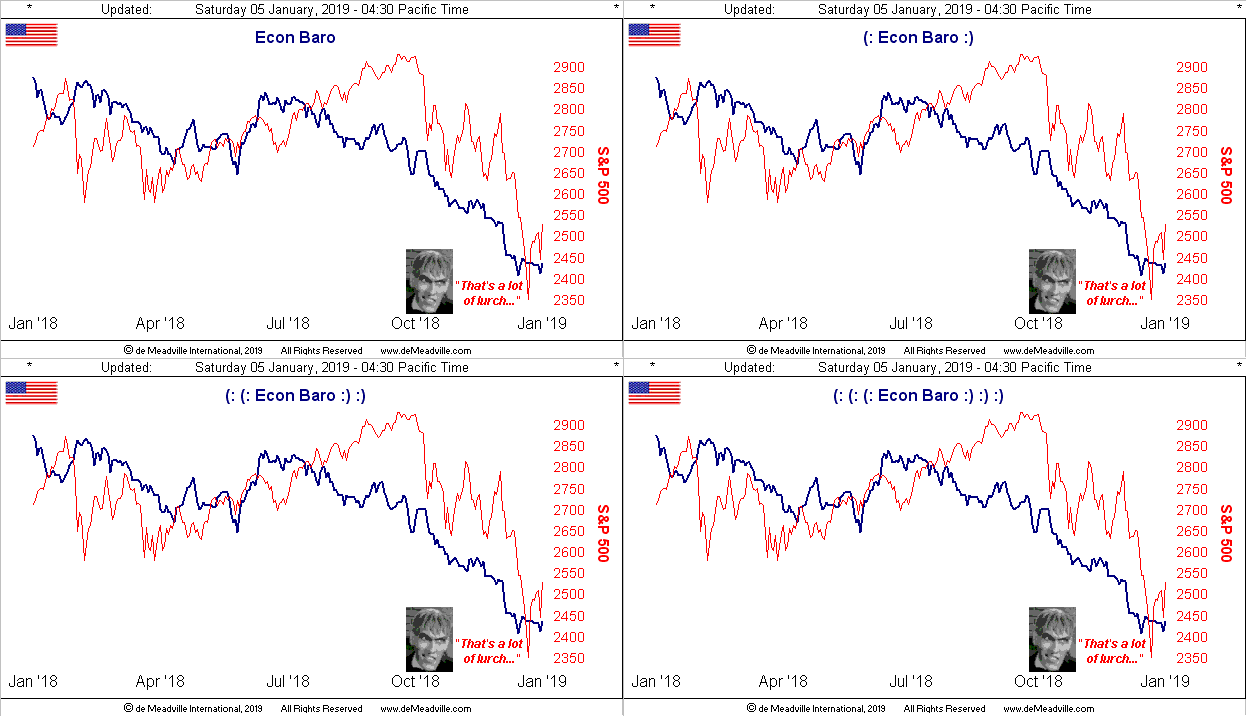
As noted, we're still looking for the "lurch-about S&P 500" to complete a full 27% correction down to 2154 (from 22 September's high of 2940) which should further aid gold's upside case. We pointed out a week ago that 75% of such correction has already been traced, the S&P has fallen in the ring to 2347 on Boxing Day. Not only do earnings remain unsupportive of price, but unhelpful as well are the Economic Barometer's incoming metrics which are all over the map. December's jobs data, (thank you holiday temp workers), blasted up to a non-farm payrolls creation of 312,000! Since we started the Econ Baro back in 1998 some 247 monthly reporting periods ago, 312k jobs ranks 13th-best, (the most ever in our records being 458k for March 2000). But the Institute for Supply Management's December manufacturing reading came in at a lowly 54.1, not just its lowest reading in two years, but also the worst month-over-month decline in nearly five years. And then there's China: ouch! Got Gold? Here's the Baro with the S&P in (appropriately) red:
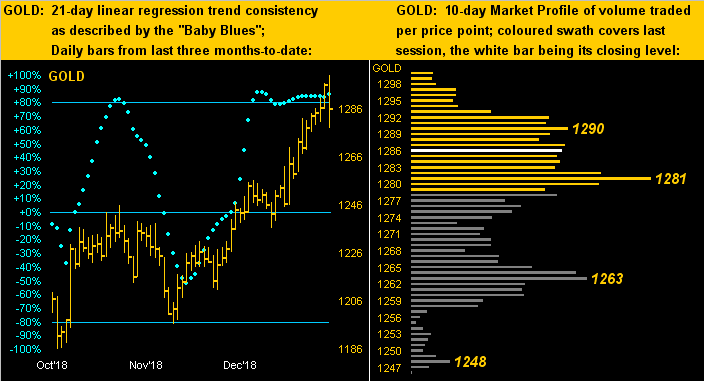
Next moving on to Gold's daily bars from three months ago-to-date on the left and the 10-day Market Profile on the right, the only thing more beautiful than seeing the baby blue dots of linear regression trend consistency walking across the ceiling would be for price itself to be twice the level 'tis, but again, 'tis what 'tis. As for the Profile, the most dominate supporter in the batch is 1281, which basically is also the top of The Box (1240-1280). Given that lengthy 17-week duration of the present parabolic Long trend, (i.e. price may be nearing a profit-taking pullback period), 'tis premature as yet to morph The Box from resistance into support ... but we're thinkin' about it:
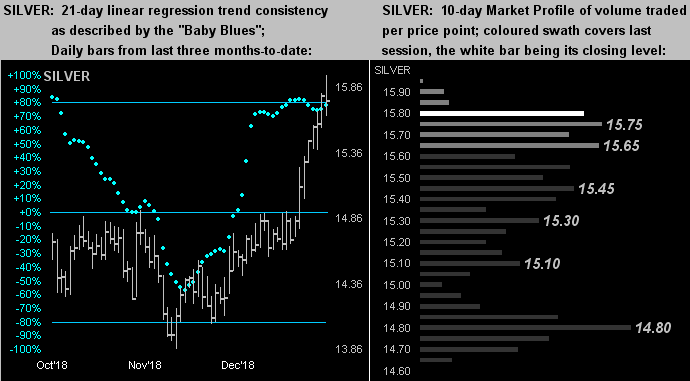
As for silver, she's more the sterling star through transiting into this year. As measured from Christmas Eve, Silver is +5.8% whereas gold is only +1.1%. More meaningfully, the gold/silver ratio closed out Christmas Eve at 85.8x but has since been reduced to 81.6x, (still an extremely high reading). As well, Silver is clearly adorned in her precious metal pinstripes, her path (below left) nearly identical to that of Gold as opposed to Copper's industrial metal jacket detour toward doom (per the like charts at the website). Silver's bevy of supporters are as labeled in her Profile (below right):
We'll close with respect to this occasionally referred-to quip from an avid reader of The Gold Update: "Gold will make you old". So shall certain studies that folks actually get paid up with which to come. In a paper on aging published last month in PLOS Biology, 'twas determined that one is closer to dying at the age of 90 than is one at 75. Quite the extraordinary finding, that. On goes the beat indeed. And may Gold's trend forever be positively correlated with one's aging!