
Reflecting top-line strength, The Goldman Sachs Group, Inc.’s (NYSE:GS) third-quarter 2017 results recorded a positive earnings surprise of 16.5%. The company reported earnings per share of $5.02, comfortably beating the Zacks Consensus Estimate of $4.31. Further, the bottom line witnessed 3% year-over-year improvement.
Though the investment bank remains under pressure due to lackluster fixed-income trading activities on low volatility during the third quarter, a continued momentum in investment banking business supported the bottom-line numbers. Further, higher debt underwriting was recorded, partially offset by lower equity underwriting.
Elevated expenses were an undermining factor. Notably, the quarter witnessed challenging market-making environment, reduced levels of volatility and low client activity levels.
Net earnings of $2.13 billion reflected a 2% increase from the prior-year quarter.
Higher Revenues Offset Escalating Expenses
Goldman’s net revenues climbed 2% year over year to $8.3 billion in the quarter under review. Furthermore, revenues handily outpaced the Zacks Consensus Estimate of $7.6 billion.
Quarterly revenues, as per business segments, are as follows:
The Institutional Client Services division recorded revenues of $3.1 billion, down 17% year over year. The fall indicates lower net revenues in Fixed Income, Currency and Commodities Client Execution revenues (down 26% year over year), adversely affected by lower revenues from interest rate products, commodities, currencies and credit products, partially offset by higher revenues in mortgage products.
Fall in commissions and fees, along with and equities client execution, partially offset by rise in securities service revenues, resulted in the downside in Equities revenues (down 7%).
The Investment Banking division generated revenues of $1.8 billion, up 17% year over year. Results displayed higher debt underwriting revenues, partially mitigated by lower equity underwriting, indicating 1% year-over-year rise in total underwriting fees. In addition, higher financial advisory revenues (up 38%) were recorded, impacted by the increased number of completed industry-wide transactions during the quarter.
The Investment Management division recorded revenues of $1.5 billion, up 3% year over year. The growth was mainly driven by higher management and other fees along with transaction fees, partially offset by lower incentive fees.
The Investing and Lending division’s revenues of $1.9 billion in the quarter were 35% higher on a year-over-year basis. The upside was stemmed by surge in revenues from investments in equities, along with debt securities and loans.
Total operating expenses flared up 1% year over year to $5.4 billion. Expenses moved up mainly due to rise in non-compensation expenses (up 4%), partly offset by decline in compensation and employee benefit expenses (down 1%).
Expenses included rise in almost all components, partially offset by lower occupancy costs, and lower net provisions for litigation and regulatory proceedings.
Strong Capital Position
Goldman exhibited a robust capital position in the reported quarter. As of Sep 30, 2017, the company’s Common Equity Tier 1 ratio was 12% under the Basel III Advanced Approach, highlighting the valid transitional provisions. The figure was down from 12.5% recorded in the prior quarter. The company’s supplementary leverage ratio, on a fully phased-in basis, was 6.1% at the end of the third quarter, down from 6.3% recorded in the previous quarter.
Adjusted return on average common shareholders’ equity, on an annualized basis, was 10.9% in the reported quarter.
Capital Deployment Update
During third-quarter 2017, the company repurchased 9.6 million shares of its common stock at an average price per share of $225.12 and a total cost of $2.17 billion.
Conclusion
Results of Goldman highlight an impressive quarter. Though trading activities weighed on the results, robust investment banking results and debt underwriting were positive factors.
The company’s well-diversified business, apart from its solid investment banking operations, continues to ensure earnings stability. Its focus to capitalize on new growth opportunities through several strategic investments, including the digital consumer lending platform, will likely bolster overall business growth. However, costs stemming from brokerage and market development remain near- to medium-term headwinds.
Goldman Sachs Group, Inc. (The) Price, Consensus and EPS Surprise
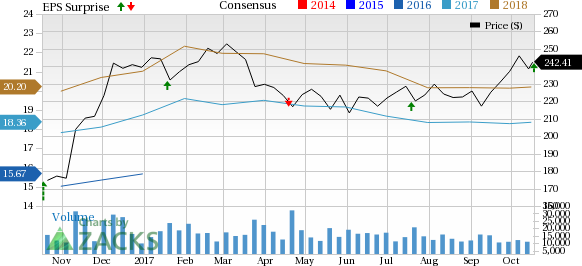
Goldman Sachs Group, Inc. (The) Price, Consensus and EPS Surprise | Goldman Sachs Group, Inc. (The) Quote
Currently, Goldman carries a Zacks Rank #3 (Hold). You can see the complete list of today’s Zacks #1 Rank (Strong Buy) stocks here.
Performance of Other Major Banks
Despite weak fixed income market revenues, Citigroup Inc. (NYSE:C) delivered a positive earnings surprise of 7.6% in the third quarter on prudent expense management. Earnings per share of $1.42 for the quarter easily surpassed the Zacks Consensus Estimate of $1.32. Also, earnings compared favorably with the year-ago figure of $1.24 per share. Notably, results included after-tax gain related to the sale of a fixed income analytics business.
Amid an expected trading slump, rising rates and loan growth drove JPMorgan Chase & Co.’s (NYSE:JPM) third-quarter 2017 earnings of $1.76 per share, easily surpassing the Zacks Consensus Estimate of $1.67. Also, the figure reflects an 11% rise from the year-ago period. Notably, the results included a legal benefit of $107 million. Solid loan growth (driven mainly by improved credit card loans) and elevated interest rates supported net interest income. In addition, rise in advisory fees supported the top-line growth. A slight fall in operating expenses acted as a tailwind.
Wells Fargo & Company’s (NYSE:WFC) third-quarter 2017 adjusted earnings of $1.04 per share were in line with the Zacks Consensus Estimate. Including previously disclosed mortgage-related discrete litigation accrual of 20 cents per share, earnings came in at 84 cents per share, comparing unfavorably with the prior-year quarter’s earnings of $1.03 per share.
Though rise in rates provided some respite, lower revenues aided by fall in non-interest income were recorded. Moreover, expenses soared. Also, reduction in loans acted as headwind for the quarter. Though the bank’s commercial portfolio improved, consumer loans disappointed. Improvement in credit quality and steady capital deployment activities were experienced.
Looking for Stocks with Skyrocketing Upside?
Zacks has just released a Special Report on the booming investment opportunities of legal marijuana.
Ignited by new referendums and legislation, this industry is expected to blast from an already robust $6.7 billion to $20.2 billion in 2021. Early investors stand to make a killing, but you have to be ready to act and know just where to look.
See the pot trades we're targeting>>
J P Morgan Chase & Co (JPM): Free Stock Analysis Report
Wells Fargo & Company (WFC): Free Stock Analysis Report
Citigroup Inc. (C): Free Stock Analysis Report
Goldman Sachs Group, Inc. (The) (GS): Free Stock Analysis Report
Original post
Zacks Investment Research