
Fundamental Analysis of Gold
As we often point out in these pages, even though gold is currently not the generally used medium of exchange, its monetary characteristics continue to be the main basis for its valuation. Thus, analysis of the gold market requires a different approach from that employed in the analysis of industrial commodities (or more generally, goods that are primarily bought and sold for their use value). Gold’s extremely high stock-to-flow ratio and the main source of gold demand – which is monetary, or investment demand – suggest that gold has to be analyzed as though it were a currency rather than a commodity.

The stock-to-flow ratios of gold and silver compared to those of industrial and food commodities. Gold’s large StFR is one of the most important features (and to a lesser extent this also applies to silver) making it useful as a money commodity.
One implication of this is that reservation demand is an extremely important factor in determining the gold price (for details on this topic see Robert Blumen’s essay “What Determines the Price of Gold”). Data on the annual flow of gold in terms of mining supply, jewelry demand, retail buying of gold eagles or net demand from central banks are insignificant by comparison.
Since none of us are mind readers, we cannot know the reservation prices/ supply schedules of current gold holders – they are not measurable. We do however know what motivates potential gold buyers and sellers, which allows us to analyze the market’s underlying trend by looking at the associated macroeconomic fundamentals.
Our friend Keith Weiner employs another approach, which attempts to determine the strength of physical gold demand by comparing spot gold prices to spreads in the futures curve. These spreads provide information on the incentives arbitrageurs have to buy or sell bullion against offsetting futures positions.
The extent of speculative buying in “paper gold” relative to buying in the physical market is one of the forces driving said spreads. Even though a data error has recently made it seem as though the derived “fundamental price” of gold was higher than it actually is, its current level of $1290 still remains above the market price.
We have recently remarked on the fact that the gold price is holding up relatively well in spite of the fact that most macroeconomic price drivers appear not particularly supportive at the moment. We will take a closer look at these drivers below.
There are essentially two types of gold price drivers worth discussing: measurable ones and those that cannot be measured (there is some degree of indirect overlap between them). The latter are inter alia described by Jim Grants simple gold price formula, according to which the price of gold is equal to 1/n. The variable “n” is “the trust in the capacity of people like Ben Bernanke [or Janet Yellen, ed.] to manage paper money”.
Drivers of the Gold Price
1. Real interest rates: when speaking about “real interest rates”, one has to define what one actually means. After all, the so-called “general level of prices” does not really exist. Adding up the money prices of completely disparate goods and services and then “averaging” them and calling the result the “general price level” is bereft of logic.
Moreover, the supply of and demand for money itself is also an important factor determining its purchasing power. This factor (which once again cannot be measured) must perforce be ignored in exercises like the calculation of CPI. For all its faults, CPI nevertheless does give us a rough idea of the speed with which the purchasing power of fiat money is evaporating.
Debt securities the yields of which are tied to future trends in CPI are providing us with a “real interest rate”. The difference between nominal rates and market-based inflation expectations is expressed in the yields of TIPS (treasury inflation-protected securities). Real interest rates are a very important gold price driver, as the charts below attests to. It shows the inverted 5 year TIPS yield compared to the gold price.

Inverted 5-year TIPS yield (red line) vs. the gold price (blue line) since mid 2012.
The longer term chart above illustrates that the negative correlation between gold and real interest rates is very strong indeed. If one looks closely at the most recent moves, we can see that a gap is currently opening between the two, which will presumably be closed one way or another. Here is a close-up view:

A close-up of the above chart showing the recent drift more clearly.
Unfortunately, there are no hard and fast rules as to which data series is more prone to lead or lag – hence we cannot say whether the gap will be closed by a decline in real interest rates, a decline in the gold price or both. However, if we simply compare the Federal funds rate directly to the annual change rate in CPI, we can see that the Fed currently remains “behind the curve”, in spite of having hiked rates three times already:

The Fed has not yet updated the chart above to reflect the most recent rate hike, so here you see that the “real” Federal funds rate stood at minus 2.13% based on February CPI data and prior to the March rate hike. If we incorporate the rate hike, it stands at minus 1.88%, which is equal to its level in January.
Overall, we would have to say that this is a mixed bag, but in the short term real rates (based on TIPS yields) are a slight negative for the gold price.
2.Credit spreads: we are keeping this simple by comparing the price of the iShares iBoxx $ High Yield Corporate Bond Fund (NYSE:HYG) (the junk bond ETF) to that of the iShares 7-10 Year Treasury Bond Fund (NYSE:IEF) (7 to 10-year T-bond ETF). It is well known that credit spreads are very tight at present, and the chart of the HYG-IEF ratio is reflecting this well enough. Junk bond yields are barely above their all time lows registered in 2014, while the yields on treasury bonds are actually still quite a bit above their previous lows (but lately decreasing again).
Credit spreads are therefore within spitting distance of their all time lows, which indicates extremely high economic confidence. In fact, economic confidence based on this indicator is currently so high that it should be considered suspect:

The HYG – IEF ratio as a proxy for credit spreads shows us that economic confidence is uncommonly high.
Tight credit spreads are normally held to be bearish for the gold price, but in view of how extremely tight spreads currently are, one might want to question the traditional interpretation. We would rather see them as a contrary indicator at the moment.
3.Steepness of the yield curve: traditionally a steepening yield curve is seen as gold bullish. The reason is that the curve normally steepens for one (or both) of two reasons: a loosening of monetary policy and/or increasing inflation expectations.

Steepness of the yield curve measured by deducting 2-Year note yields from 10-year note yields. After steepening sharply between September and December 2016, the curve has begun to flatten again .
This indicator had a strong positive correlation with the gold price from 2000 – 2003 and again from 2007 – 2011, but occasionally the correlation breaks down (e.g. in 2005-2006 and recently). We suspect this tends to happen most often in “transitional periods” in which a gold-bearish macroeconomic backdrop is about to shift to a gold-bullish one, but the shift has not actually happened yet.
4.Trend of the US dollar: The US dollar was in a quite strong uptrend for a while and more recently is moving sideways with an upward bias. Technically the dollar certainly continues to look strong and a number of fundamental reasons supporting dollar strength could be cited as well, even if that is a somewhat less straightforward exercise (to what extent the rally in the US dollar has already discounted these positive factors is open to question).

DXY weekly: a strong rally from early 2014 to early 2015, followed by an upwardly biased consolidation.
This would normally be considered bearish for gold, but there are time periods during which a strong dollar and a strong gold price can co-exist (most recently demonstrated on occasion of the euro area debt crisis).
5.The performance of financial stocks relative to the broad market. This is an indicator for the gold price that was to our knowledge first mentioned /discovered by Steve Saville, author of the excellent Speculative Investor newsletter. The health of the banking system is certainly an important factor for gold demand, as demand deposits at banks are for the most part uncovered money substitutes, while depositors are legally considered unsecured creditors of banks (although it often appears that many are unaware of this status, we still see bank runs whenever push comes to shove).
It stands to reason that the ratio of bank stock indexes to broad market indexes inter alia reflects confidence in the banking system. Since gold is an asset without a corresponding liability and contrary to bank deposits does not depend on anyone’s promise to pay, gold demand should rise when this confidence is undermined and fall when it strengthens. That can indeed by seen in a comparison of the performance of the BKX-SPX ratio vs. that of the gold price. In the chart below the gold price is inverted in order to illustrate this (negative) correlation more clearly:

Performance of the BKX-SPX ratio (black line) vs. the inverted gold price (red line).
From mid 2016 to early 2017 the trend in this indicator turned bearish for gold, but recently it has become more bullish again. The (inverse) correlation remains remarkably strong, so we would regard this as one of the more important indicators at the moment.
6.The trend in commodity prices: it is no secret that the price trends of commodities and gold are usually aligned. One must keep in mind though that considerable leads and lags can be observed in this context (generally the gold price tends to lead commodity prices). As an aside, gold has strengthened relative to commodities for quite a long time and is not exactly cheap compared to them.
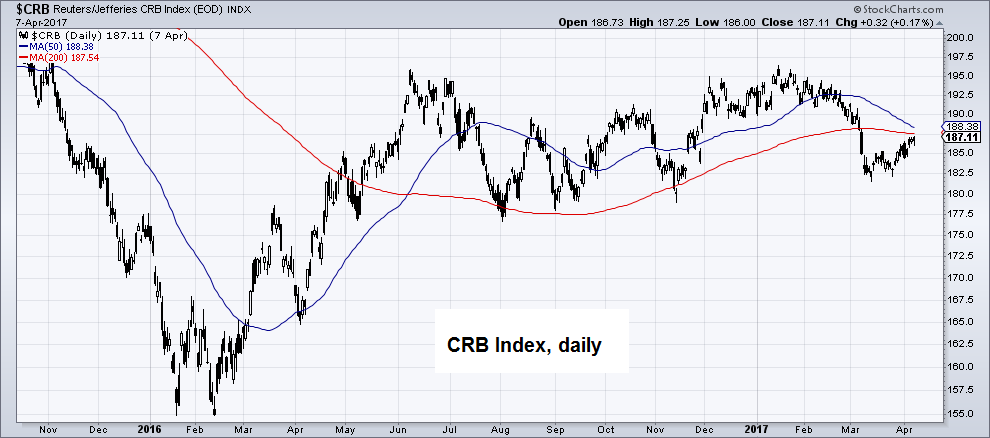
CRB Index, daily: since its low in early 2016, the CRB has been in a sideways trend.
Note that the CRB reflects the “roll effect”; when most of its components are in contango in the futures markets, it will underperform (and vice versa when most of them are in backwardation).
The CRB Index appears to give a neutral/ bearish signal at present, but things look a bit better in terms of the BLS cash commodity index, which doesn’t reflect the roll effect from futures contangos:

While the BLS spot commodities index has weakened a bit recently, it has previously also moved to higher levels than the CRB.
We would say this indicator is neutral at the moment.
There are two more “measurable” indicators we could show charts of. One of them is the rate of change in money supply growth, which we have recently discussed. A chart of the money AMS growth rate can be seen here. Clearly this would currently be deemed rather negative for gold prices, but as we pointed out, a loss in excess liquidity may at the moment affect risk assets more significantly than gold, which may well benefit from if the former come under pressure.
Other charts we could show in this context are the trends in the prices of risk assets such as stocks and junk bonds, but these are well known anyway. Their current strength is clearly a negative factor for gold. Once again this strength could almost be seen as a contrary indicator though, considering how extremely stretched valuations have become.
Conclusion
In conclusion, most of the “measurable” macroeconomic fundamentals that are considered important drivers of the gold price are either mixed/neutral or bearish at the moment. However, there are good reasons to believe that several of them will turn gold-bullish as a result of the current tightening of monetary policy, which will ultimately undermine risk asset prices and various bubble activities in the economy – “forcing” central banks to execute another u-turn.
We will discuss non-measurable gold price drivers such as trust in government and the monetary authority, confidence in the solvency of the banking system, the demand for money/ desire to increase precautionary savings, economic confidence in general and similar aspects in a separate post. Naturally, many of these are indirectly reflected in the measurable indicators shown above, but there is still more to be said about them.