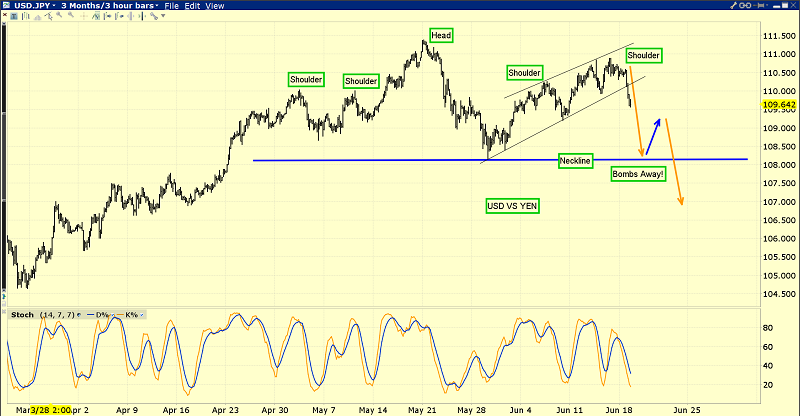
The dollar and the US stock market may be starting their next major legs down today. This is the ominous US dollar versus Japanese yen chart.
Central banks around the world are ramping up their tightening. Back in 2013-2014 when I predicted quantitative tightening and relentless rate hikes were imminent, almost nobody believed me.
I promised that this tightening cycle would be like no other because of the enormous size of the QE money balls in Japan, Europe, and America. The tightening action is moving the money balls out of the deflationary government bonds asset class and into the inflationary fractional reserve banking system.
Powell just raised rates again and is poised to launch another increase in quantitative tightening. He’s also beginning to change the spread between the Fed funds rate and the excess reserves rate that banks get paid to keep money at the Fed.Going forward, I expect him to put much more pressure on banks to move money out of the Fed. This is highly inflationary action.
The US stock market looks like a technical train wreck.
For the stock market, one mainstream money manager just referred to the global tightening cycle in play as akin to a sports team losing its goalie!
It’s obvious that the stock market is doomed. Powell appears determined to push through another rate hike in either August or September. Maybe the market staggers sideways or slightly higher until then, but the US stock market train is headed towards a global central bank tightening cliff. It’s going to go right over that cliff and implode, and tariffs are just icing on the cake.
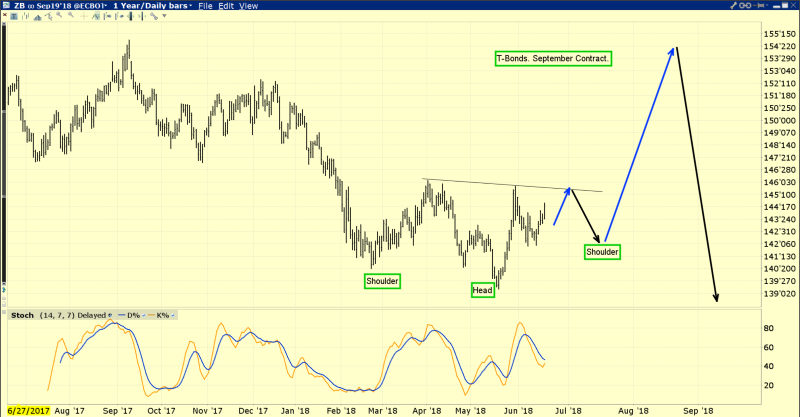
This is the interesting T-Bond chart. Stock market money managers usually buy bonds when they panic, and that’s starting to happen now.
This time they are jumping from the fire to the fry pan. They believe the Fed will blink and stop hiking. In contrast, I predict the hiking will be accelerated, with a possible half point hike coming in December as inflation continues to rise.
Because of the widening spread between the Fed funds and excess reserve rates, banks will become more aggressive about moving money out of the Fed. Ultimately, the money managers will panic-sell bonds and buy gold as they see the stock market melting but inflation getting even stronger.
The bottom line is that Powell’s tightening actions to date have not done enough damage to the bond market to kill it as a safe haven for stock market investors. That will change fairly soon.
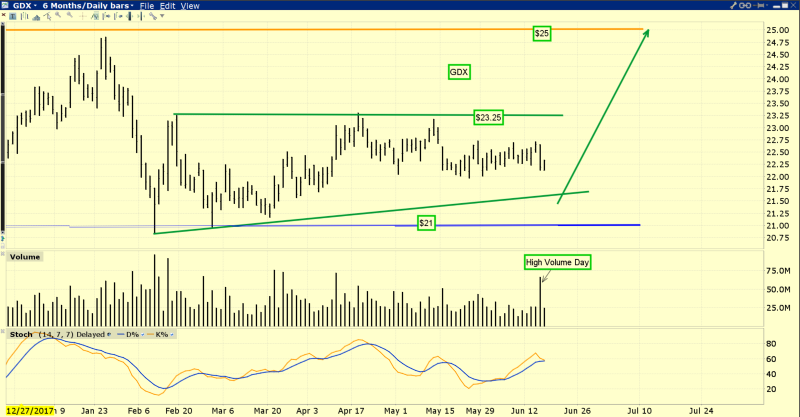
This is the VanEck Vectors Gold Miners ETF (NYSE:GDX) chart. Gold stocks continue to meander sideways in my important $23 to $21 accumulation zone.
Many individual miners have started to trade independently of the ETFs and mine stock indexes, and are staging fabulous rallies. There are always some outperformers in a sideways market, but the large number of them staging these rallies now is quite impressive.
Note the strong volume bar that occurred on Friday. Gold stocks are in very strong hands now at a time where some possible “game changing” news is coming for bullion.
India and China are the biggest markets for physical gold, and price discovery on the COMEX and LBMA ultimately relates to changes in demand there versus mine and scrap supply.
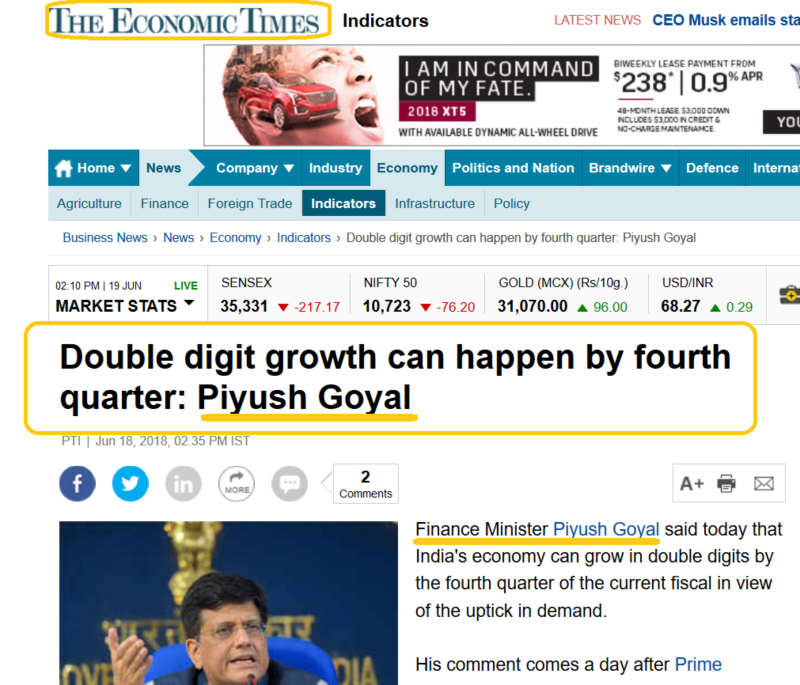
When Narendra Modi got elected as India’s prime minister, he put Arun Jaitley in charge of the finance department. This was disappointing, because Jaitley’s actions and words have been very negative for gold, and the finance ministry has the power to set the gold import duty.
Jaitley has a long history of health issues, and he just had a kidney transplant. Piyush Goyal has been appointed as “interim” finance minister. He’s pro-gold and fought against the import duty. There are rumors that his appointment may become permanent.
If that happens, I think gold investors around the world are going to watch the import duty tapered to zero just like American QE was tapered to zero.
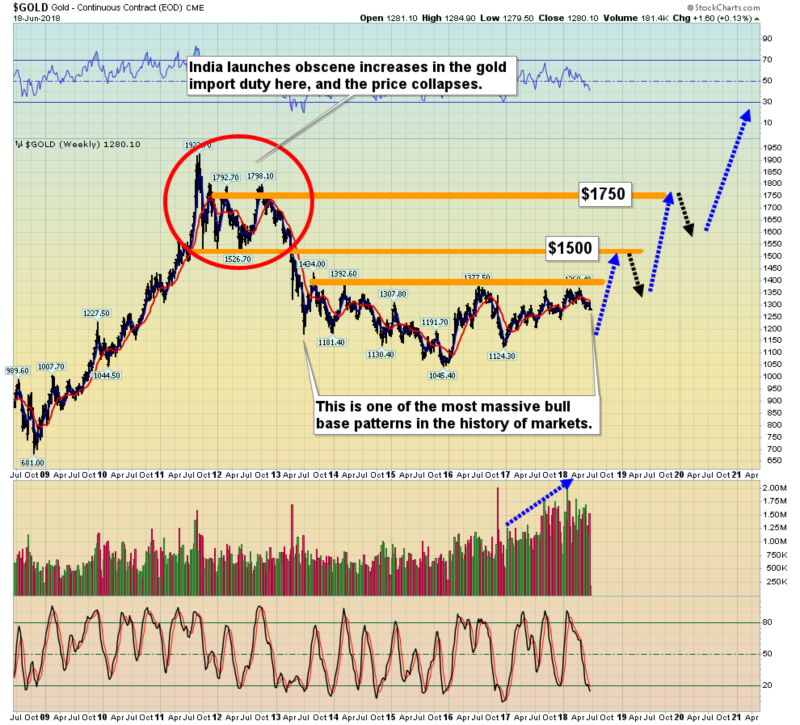
This is the spectacular long-term gold price chart. The Indian finance ministry is the main driver of the global gold price doldrums that have been in play for the past seven years.
It’s unknown if Goyal takes charge of the finance ministry on a permanent basis, but if he does, that is likely the catalyst that launches a massive and sustained rise in Indian gold demand. That demand will be enough to drive gold in an Elliott C wave advance to at least $1650, and probably $2000!
If “Royal Goyal” has charge of India’s finance ministry at the same time as Powell is joined by the ECB and then Japan in a giant effort to roll the QE money balls into the fractional reserve banking system, gold will likely surge to $3000 - $5000 very quickly.
When gold began its “eight-bagger” advance from the $250 area in 1999, few people anticipated the upside potential. The highest price targets coming from mainstream analysts were in the $400 area. Most of them thought gold was going to stay in the doldrums for decades, while the stock market would never decline in a material way. They had no clue what was coming!
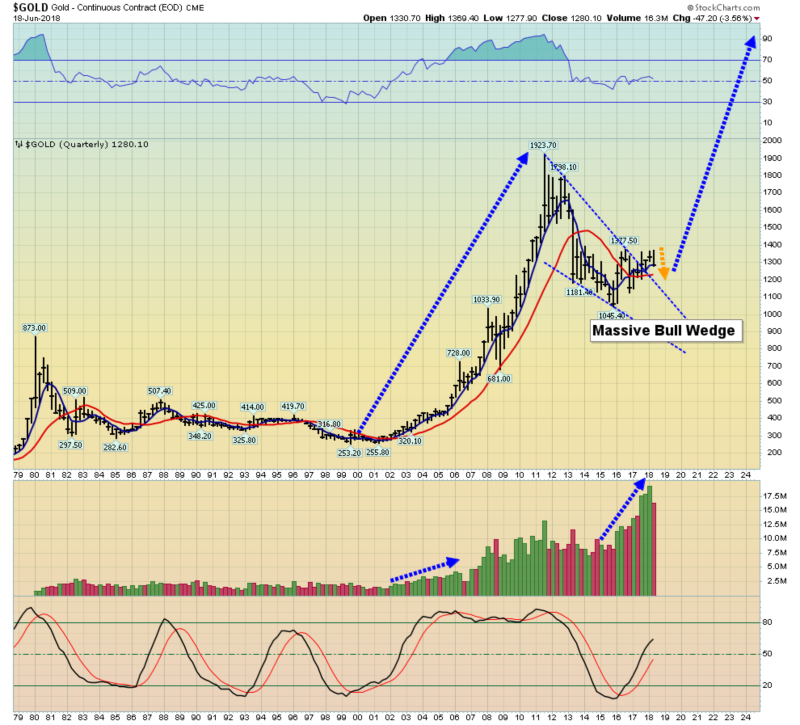
I believe the potential for another eight-bagger is much stronger now than it was in 1998. This quarterly bar chart shows gold making an epic bull wedge breakout.
All that’s technically in play right now is a pullback from the breakout zone and that’s very healthy. Note the rise in volume from 1998-2002. That came ahead of the runaway action in the price. The exact same thing is happening now. Gold and silver investors should have absolute confidence in their holdings… and look to eagerly accumulate more!
