Gold's primary upside driver is currency Debasement, further enhanced by the other of the 3Ds: Debt and Derivatives. Thus axiomatically, Gold's primary downside driver is shrinkage of same. We don't see that happening anytime soon. Indeed, fading Gold's 5,000-year pricing uptrend would be a bad idea.
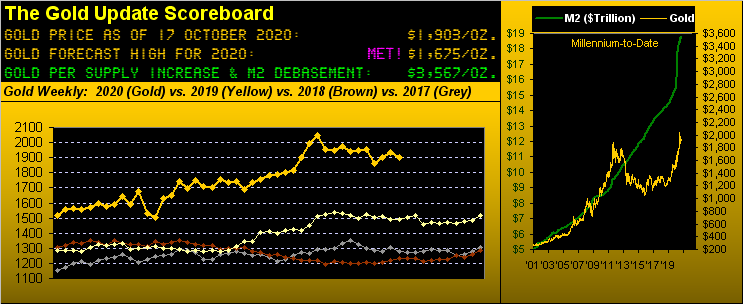
Yet since Nixon's nixing of the Gold Standard back in '71, more short-lived events driven by fear, the unknown, and the unconscionable manipulative entity, have spiked the Gold price, after which it generally reverts from whence it came. To wit, the looming StateSide election (03 November) ought well be a classic case, after which we'll know "The Name of the Game"--[ABBA, '77] for either further economic gain or private sector drain.
Whilst no one "knows" the election outcomes, be they at the Executive or Legislative levels, (with the structure of the Judicial level hanging in the balance), the rash of mainstream consensus again already "knows" that which they "knew" four years ago: that a Big Blue Wave is to consume America ... (except that the colour turned out instead as Red).
But this time 'round were Team Blue to really come through, 'twould be as wonderful a Gold Positive as for which one could ask. Indeed so much so, the above Scoreboard's Gold value of 3567 could arrive ever so fast. And yet, with just over two weeks until Election Day, in the markets neither a higher Gold gear nor pre-election fear has yet to appear.
'Tis a bit odd, non? To be sure, Team Blue are the masters of swaying public opinion as sourced through the highest levels of respected media, feeding upon those emotive, and driving polling favourably-heavy to their side. Team Red on the other hand looks to be sourced through what it deems as common sense vessels, relying upon those composed, and their ultimately vindication of truth via the voting booth.
Again no one "knows": Team Blue's win is already in the polls; Team Red's win is already in the markets. Were it the other way 'round, Gold would by now have soared and the stock market by now have been floored. So apolitically, given the market is never wrong, it senses status quo as forward we go.
'Course with time still on the table, as the old San Francisco Examiner's (afternoon newspaper) advertising billboard used to say: "A lot can happen between 9 & 5". Moreover, at the end of the day, it must be said that both Teams Blue and Red are good for Gold. Enhanced by the impacts of COVID management and Team Red in charge these past four years, the currency's been severely Debased, the rate of Debt extension significantly increased, and Derivatives run so amok that trying to cash in can find one stuck in their muck.
So either way, be it Team Blue or be it Team Red, the real winner one "knows" will be Team Gold, albeit come Election Night, volatility shall beget price spikes and dislikes.
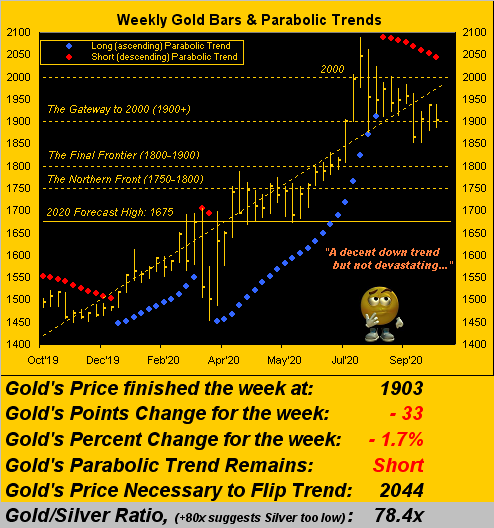
As for "The Now", 'tisn't that Gold is really being disliked; rather, 'tis continuing to be stuck within the ongoing medium-term negative trend herein graphically portrayed these recent weeks. Here we've Gold's weekly bars, their declining red dots now depicting eight weeks of parabolic Short trend. Nonetheless, price is showing some resiliency within such trend despite the week's loss of 33 points (-1.7%), Gold settling yesterday (Friday) at 1903. That is 144 points below the ensuing week's "flip to Long" price at 2044; (Gold's expected weekly trading range is now 80 points, although that breadth has not been exceeded these past three weeks). Here's the picture, the broader, dominant trend remaining up... well UP!
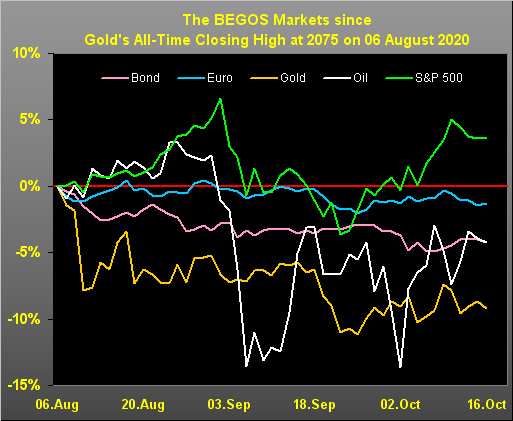
In fact, let's see how all five of the primary BEGOS Markets (Bond / Euro / Gold / Oil / S&P) have fared by their respective percentage tracks since Gold's All-Time Closing High of 2075 some 11 weeks ago on 06 August. Clearly Gold has been the weakest of the bunch and the S&P the firmest, with Oil winning the "Miss Volatility" award.
"So 'Oh that dollar strength', right, mmb?"
The Dollar Index is a bit stronger through that period, Squire, by +1.0%. But your notion is well-founded that when "everything is down", the Dollar is up. Yet in this case, the stock market, too, is up, despite foreign revenues thus being a bit more expensive. Of more import, (pun intended), are the early stages of Q3 Earnings Season. "They're great!", right? Of course 'tis still very early in the Season, but with 32 of the S&P 500's constituents having already reported, 25 of 'em (78%!) have beaten estimates, effectively excitable for the FinMedia. But 'tis only here that you'll hear just 12 of 'em (38%) actually bettered their bottom lines from Q3 a year ago. And that is going to do nothing toward lowering our "live" price/earnings ratio for the S&P of 58.1x.
Specific to the economy, 'twas a lackluster week for the Economic Barometer, the fiscal year-ending September Treasury Budget deficit extending its 12-month gap to a record $3.1 trillion. Too, September's Industrial Production shrank by -0.6% from a +0.4% expansion in August. As well, the New York State Empire Index fell from 17.0 in September to 10.5 for October, whilst just 95 miles down I-95 the Philly Fed Index more than doubled from 15.0 to 32.3. And both Retail Sales and wholesale inflation sported September gains. Cobble it all together, throw on the S&P for good measure, and the climb-out from COVID's depths has been quite a treasure:
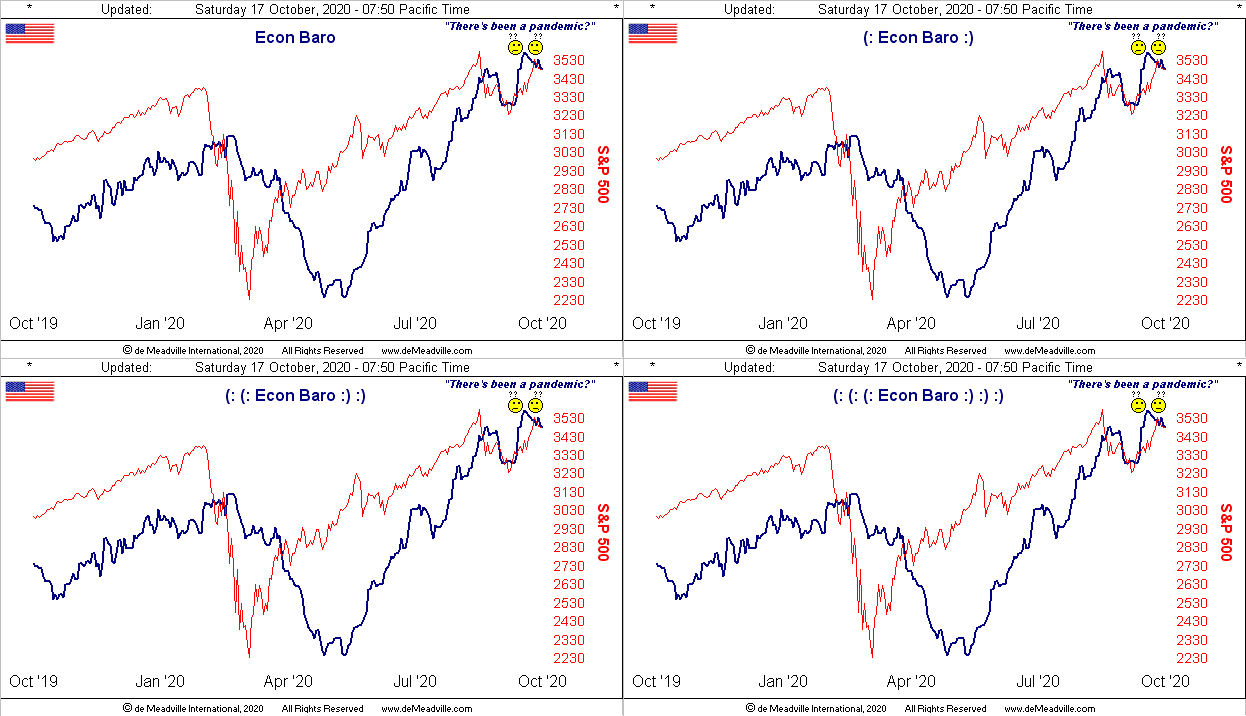
Indeed one wonders if Federal Reserve Vice-Chair Richard "Reconnoitering" Clarida has been reviewing the Econ Baro, his noting this past Wednesday before the Institute for International Finance that "the briefest recession in U.S. history" may already be behind us, but that monetary and fiscal support measures remain necessary. Got Gold? In concert, the International Monetary Fund sees the need for more stimulus, global public debt being sent to record heights. Reprise: Got Gold?
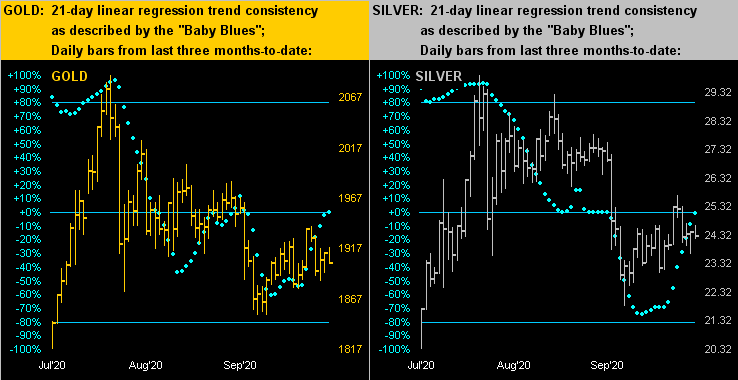
Below, we've got Gold in the left panel by daily bars from three months ago-to-date. See the baby blue dots of linear regression trend consistency? They've returned up to the 0% axis line, meaning the near-term negativity has been neutralized. And same is the case for Silver in the right panel, her "Baby Blues" also back up to mid-chart. Perhaps now a li'l ole-fashioned pre-election fear shall put Gold (and Silver!) up a gear:
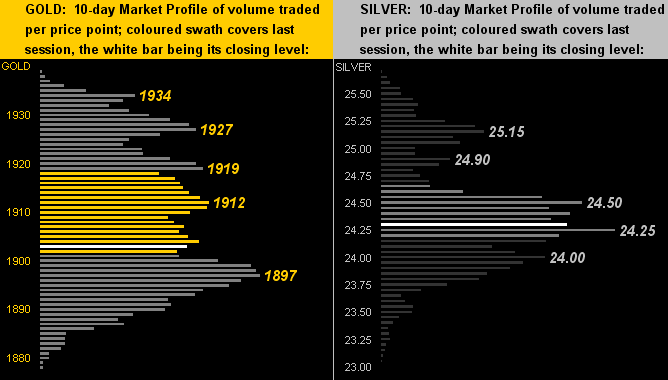
Pairing the precious metals by their 10-day Market Profiles, here next we've that for Gold on the left and same for Silver on the right. Gold's key underlying, volume-dominant supporting price is 1897 whilst for Sister Silver she has two at 24.25 and 24.00. Still, the upside trading resistors are as also shown:
And thus we go to The Gold Stack:
The Gold Stack
Gold's Value per Dollar Debasement, (from our opening "Scoreboard"): 3567
Gold’s All-Time Intra-Day High: 2089 (07 August 2020)
2020's High: 2089 (07 August 2020)
Gold’s All-Time Closing High: 2075 (06 August 2020)
The Weekly Parabolic Price to flip Long: 2044
10-Session directional range: up to 1939 (from 1877) = +62 points or +3.3%
Trading Resistance: 1912 / 1919 / 1927 / 1934
10-Session “volume-weighted” average price magnet: 1909
Gold Currently: 1903, (expected daily trading range ["EDTR"]: 29 points)
The Gateway to 2000: 1900+
Trading Support: 1897
The Final Frontier: 1800-1900
The Northern Front: 1800-1750
On Maneuvers: 1750-1579
The 300-Day Moving Average: 1670 and rising
The Floor: 1579-1466
Le Sous-sol: Sub-1466
The Support Shelf : 1454-1434
2020's Low: 1451 (16 March)
Base Camp: 1377
The 1360s Double-Top: 1369 in Apr '18 preceded by 1362 in Sep '17
Neverland: The Whiny 1290s
The Box: 1280-1240
For this week's wrap, is it too early to note that neither a higher Gold gear nor pre-election fear has yet to appear? Not so, per a piece off the Dow Jones Newswires as to how folks already are getting positioned. Quote: "Traders are buying shares of green-energy companies and gauging the impact of possible corporate-tax increases as they prepare for a potential Biden win." That puts traders on Team Blue. But as the broad market continuously refuses to tank to unsupportive earnings, let alone a Biden win, that puts (so as to differentiate) investors on Team Red. So what to do? From a piece penned last December for our good friends over at Investing.com, we wrote:
"...Our apolitically-objective view by simple mathematics is the President being re-elected as his voting base will again fully turn out plus shall some material percentage of the once “never-Trumpers”. But the Trade of the Year is to sell the S&P going into Election Day (03 November), even front-run it. The S&P is as excessively expensive as we’ve ever seen it, our “live” P/E at this writing 38.9x ['tis today as noted 58.1x], the Index itself year-to-date +28.5%, and more than one-third of the constituents not bettering their bottom lines in 2019 ['tis so far 63% not bettering via Q3]..."
Therefore: selling the S&P for a Team Blue win is obvious. But so is selling the S&P for a Team Red win, if for no other reason than "The End" of the run is then in sight four years hence, during which time valuations come back into normal line -- which without earnings doubling, even tripling, means for the S&P a 50% coupe de cheveux, mes chers vieux. So again: Got Gold?