It has been a bad week for gold bulls. The yellow metal has been trading in a range between $1260 and $1306 for over two months and many thought it was trying to find a base to bounce up from. Unfortunately, the $1260 support everyone was heavily relying on suddenly gave up, opening the way for the bears to drag the price of gold to as low as $1244.
Fundamentally speaking, there was a pretty good reason for gold prices not to decline. Donald Trump declared Jerusalem the capital of Israel, causing outrage in the already destabilized Middle East. According to The Independent, Trump’s decisions risks uniting the Arab world against the United States, so one might think political and economic tensions are about to rise. Normally, gold is considered to be a safe haven in times of uncertainty, so it makes sense to expect its price to go up. Alas, common sense is not always a good ally in the markets.
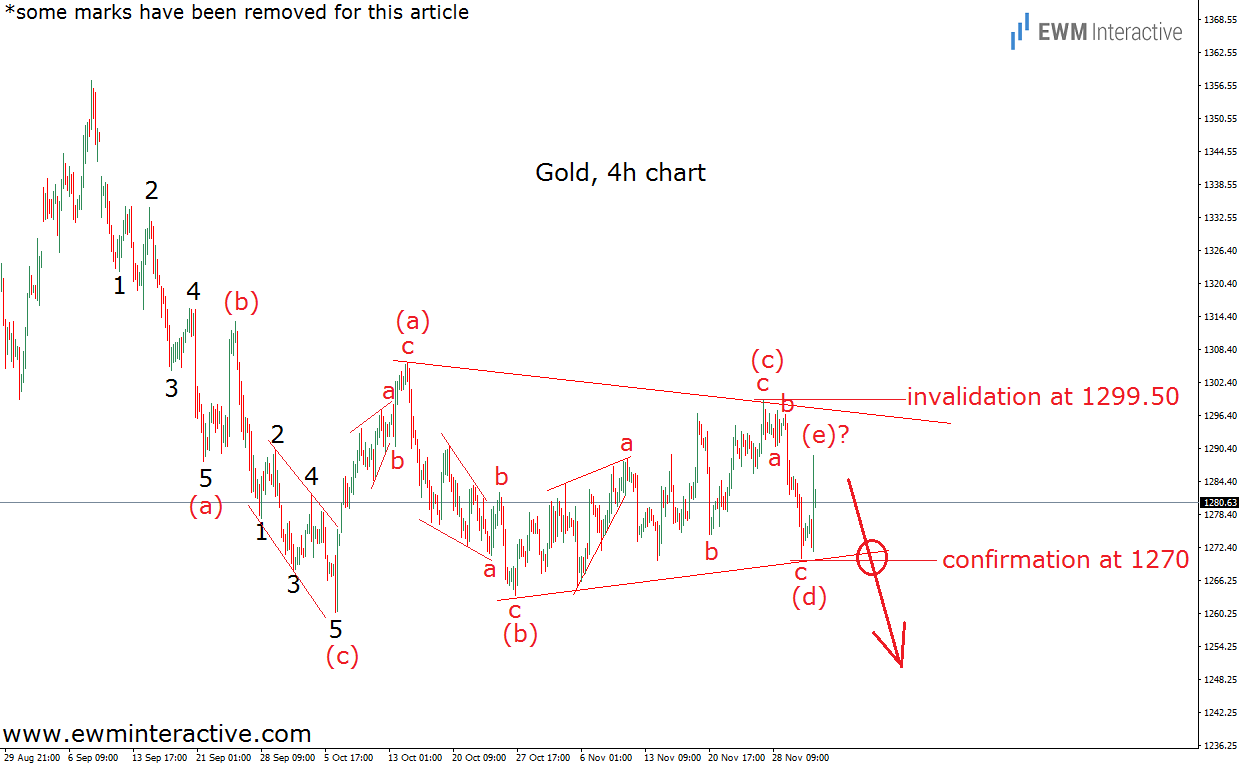
Here is how the Elliott Wave Principle put traders ahead of the market once again. The chart below was sent to subscribers before the market opened on Monday, December 4th.(some marks have been removed for this article)

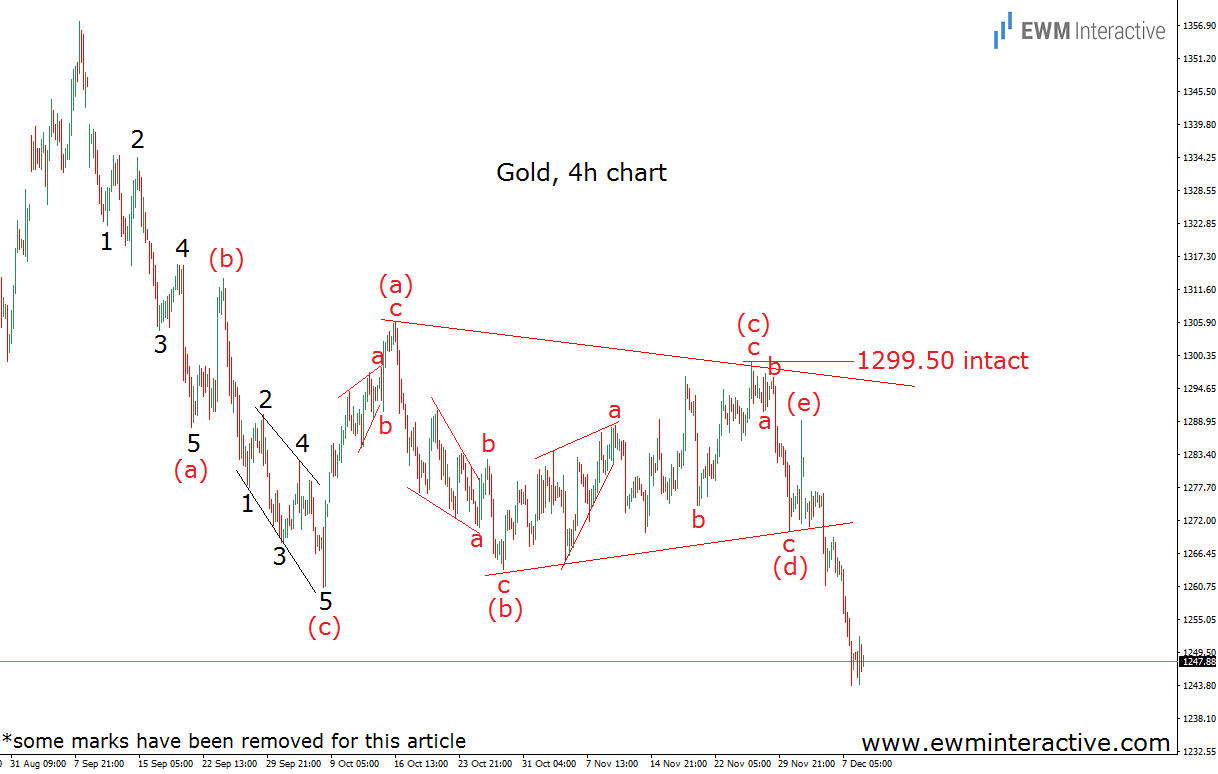
Instead of relying on external factors such as news and events, we pay more attention to price patterns. The one we recognized on the chart above is called a triangle. Triangles are continuation patterns. A triangle is nothing more than a correction, which temporary interrupts the larger trend. In XAU/USD’s case, the triangle in question was preceded by a three-wave (a)-(b)-(c) decline from $1357 to $1261. This led us to the conclusion, that once the triangle was over, the trend should resume to the downside. In addition, this pattern usually comes with a specific invalidation level. Wave (e) was not supposed to exceed the highest point of wave (c), so as long as gold was trading below $1299.50, lower levels were anticipated. The next chart shows how things went.

$1299.50 was never in danger. Gold prices headed south almost from the start and despite the fact that the tensions between Israelis and Palestinians in Jerusalem quickly escalated to armed clashes, the precious metal suffered its worst week since July. If it was not for the Elliott Wave principle, we too would be scratching our heads in bewilderment.
