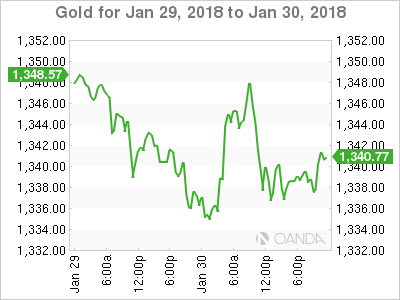
Gold has ticked lower in the Tuesday session. In North American trade, the spot price for an ounce of gold was $1339.51, down 0.13% on the day.
The precious metal took advantage of the U.S. dollar selloff last week, but the currency has posted a steadier performance this week. Gold moved higher earlier on Tuesday, but most gains were wiped out on the back of a superb U.S. CB Consumer Confidence report, which surprised to the upside at 125.4, above the estimate of 123.2 points. The indicator continues to move upwards, highlighting strong optimism about the economy. Stronger consumer spending has also led to a surge in imports in Q4, which in turn weighed on Advance GDP, which was softer than expected at 2.6%.
On Wednesday, a batch of other key indicators is coming up from the U.S., led by the ADP Nonfarm Employment Change. And the Federal Reserve will release a monetary policy statement, with the markets expecting the benchmark rate to remain unchanged at a range between 1.25%-1.50%.
All eyes are on the Fed's rate announcement, the final one under Janet Yellen’s watch. The tone of the rate statement could affect investor sentiment and have an impact on gold prices. It’s a virtual certainty that the central bank will leave rates unchanged this time around, although it’s likely that it will raise rates by a quarter-point at its next meeting in March. Yellen will make way for Jerome Powell, who takes over as chair in early February. Powell is expected to hold the course on monetary policy, which was marked by small, incremental interest rates hikes last year in order to keep the robust U.S. economy from overheating.
XAU/USD Fundamentals
Tuesday (January 30)
- 9:00 US S&P/CS Composite-20 HPI. Estimate 6.3%. Actual 6.4%
- 10:00 US CB Consumer Confidence. Estimate 123.2. Actual 125.4
- 21:00 President Trump Speaks
Wednesday (January 31)
- 8:15 US ADP Nonfarm Employment Change. Estimate 191K
- 8:30 US Employment Cost Index. Estimate 0.5%
- 9:45 US Chicago PMI. Estimate 64.3
- 10:00 US Pending Home Sales. Estimate 0.5%
- 14:00 US FOMC Statement
- 14:00 US Federal Funds Rate decision. Estimate
*All release times are GMT
*Key events are in bold
XAU/USD for Tuesday, January 30, 2018

XAU/USD January 30 at 13:00 EST
Open: 1349.77 High: 1352.50 Low: 1334. Close: 1338.60
XAU/USD Technical
| S3 | S2 | S1 | R1 | R2 | R3 |
| 1285 | 1307 | 1337 | 1375 | 1416 | 1433 |
- XAU/USD posted losses in the Asian session. XAU/USD recovered and moved higher in European trade. The pair has given up most of these gains in North American session
- 1337 was tested earlier in support and is under pressure
- 1375 is the next line of resistance
- Current range: 1337 to 1375
Further levels in both directions:
- Below: 1337, 1307, 1285 and 1260
- Above: 1375, 1416 and 1433
OANDA’s Open Positions Ratio
XAU/USD ratio is showing little movement in the Tuesday session. Currently, short positions have a majority (57%), indicative of trader bias towards XAU/USD continuing to lose ground.
