
Gold is trading at levels last seen over a month ago, following mixed signals from U.S. and China on trade, Brexit worries and protests in France. The demand for safe haven assets is thought to be increasing at times of political and economic uncertainty, which helps explain the surge in the price of gold.
On the other hand, only a week ago, gold was down to $1211 and few thought a retest of $1240 was on the horizon. Furthermore, none of the information which is now used to explain gold’s rise is actually news. Protesters in France have been on the streets for weeks now, the trade war situation seems to be actually improving, and the possibility of a hard Brexit has been circulating in the media for many months.
Very often the same news can explain both a rally and a decline in the price of an asset, depending on the interpretation. The problem is that interpretations can only be made after the fact, which does not help traders much. That is why we choose to focus our attention directly on what the market is saying through its price charts. The chart below, for example, was sent to our subscribers on November 28th. It shows that there was a way to predict gold’s rally, instead of wasting time explaining it afterwards.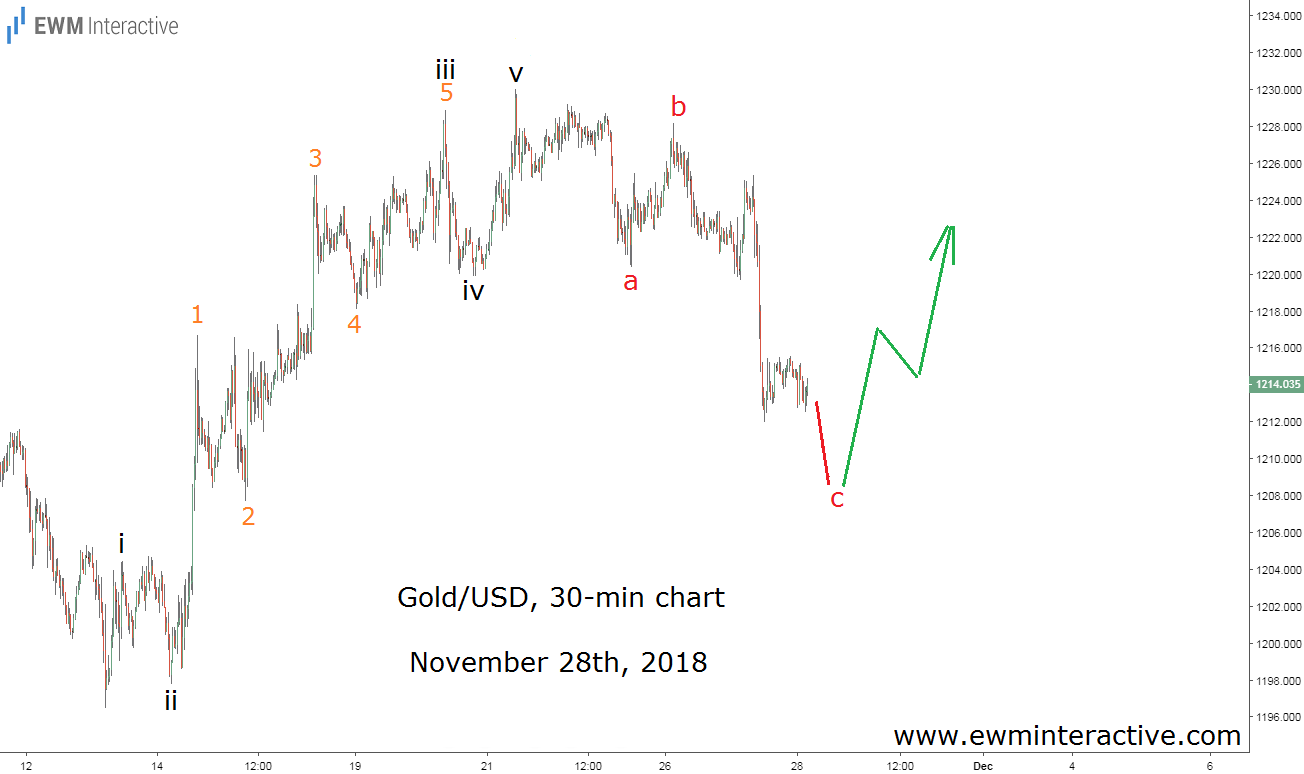
The method that put us ahead of gold’s recovery is called the Elliott Wave Principle. It is a pattern-recognition technique discovered by Ralph Nelson Elliott in the 1930s and it still helps analysts today.
The pattern we managed to recognized over a week ago is called an impulse. According to the theory, every impulse consists of five sub-waves and is followed by a three-wave correction in the opposite direction. Once this 5-3 wave cycle is complete, the trend resumes in the direction of the five-wave pattern.
The chart of gold above revealed an impulsive recovery from $1196 to $1230, labeled i-ii-iii-iv-v, where the sub-waves of wave iii were also visible. Naturally, an a-b-c decline followed. Since the 5-3 cycle seemed to be almost over on November 28th, we assumed a bullish reversal can soon be expected. And not a single piece of news was taken into account. Here is what happened next: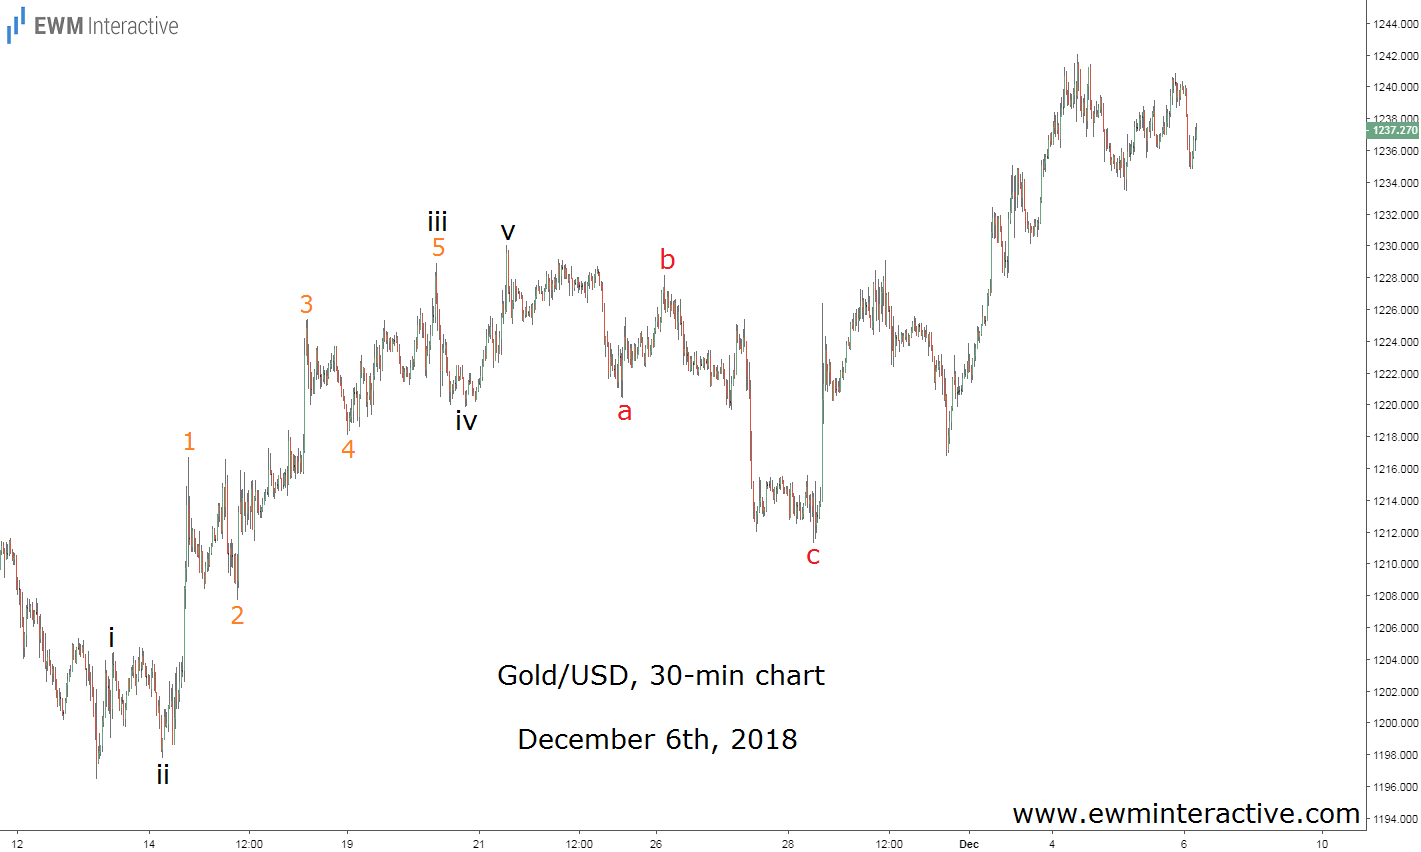
Gold bounced up sharply the very same day, giving the start of a rally to $1242 by December 4th. In our opinion, all the news during the last week may have helped the rally, but did not cause it, because the Elliott Wave stage was already set for a recovery anyway.
Now, unless you have a crystal ball, there is still no way to know how the global political and economic situation will develop. Traders who base their buy and sell decisions on news are doomed to always be late, which is often the same as being wrong. The Elliott Wave principle is not flawless as well, but it is the best method we have found to stay ahead of the market’s next move.