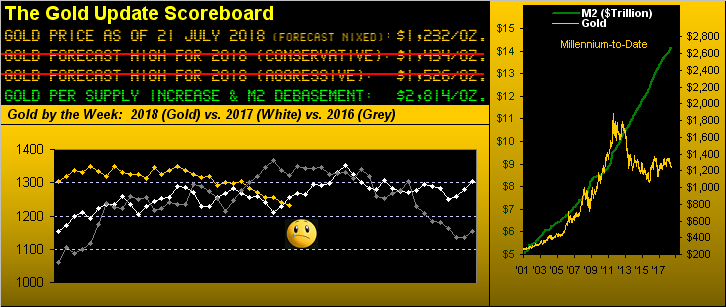
High-country greetings from Squaw Valley at 6,200 feet -- but without an Olympic Gold medal, the metal for which we must extend low-price greetings at $1,232/oz. 'Tis the level at which Gold settled yesterday (Friday) in officially closing out the week below The Box (1280-1240), in turn nixing our conservative forecast high for this year of 1434, (let alone our aggressive forecast high of 1526).
"Isn't that throwing in the towel a bit early, mmb?"
Ah, there you are, Squire, back from Moscow and, so I've heard, now schmoozing around over at Sunnyside. Your thought is encouraging, and to be sure, nothing is cast in stone. But the numbers are completely against Gold getting up there by this year's end, barring a swiftly substantive swing in sentiment such as to send price skyrocketing. And whilst the future is not always a replication of the past, here's the cold, hard historical truth:
Year-to-date, Gold is at present -5.6%. Not that daunting a loss, perhaps, but this marks Gold's third worst performance to this point of the calendar year since the turn of the millennium in 2001. The only two years weaker to this point were 2015 (-7.3%) and the never-to-be-forgotten 2013 (-22.7%).
The latter of those two years sported the better recovery from that point into year's end, closing en route as much as 9.4% higher. Replicating that performance this year from Gold's present 1232 level would bring price up to just 1348, shy of the year's high thus far of 1369. Moreover to reach our once-forecast 1434 level, the rise from here would have to be 16.4%. Such percentage rise has happened from this date in six other "better years" since 2001; but as pointed out a week ago: there are "...too many overhead barriers of price resistance to overcome toward reaching 1434 this year: The Box, The Whiny 1290s, and The 1360s Double-Top, the latter in the last two years repelling price from returning all the way up to the launch point of Base Camp 1377..." So in facing the music, Gold "...ain't gonna shine anymore..."for price to reach 1434 in 2018, (thank you The Walker Brothers, 1965).
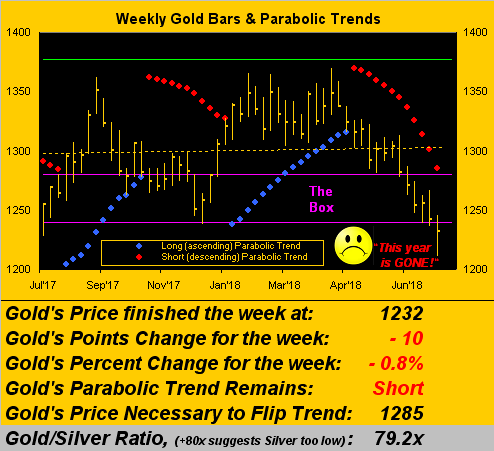
And the proof is in the pudding per Gold's weekly bars, having within their parabolic Short trend now recorded their sixth consecutive lower low, and in doing so, materially busting through the bottom of The Box in recording the year's low-to-date of 1211. Notwithstanding the 21-point bounce into week's end, 'twould appear by Gold's historical measurings millennium-to-date that this year is gone:
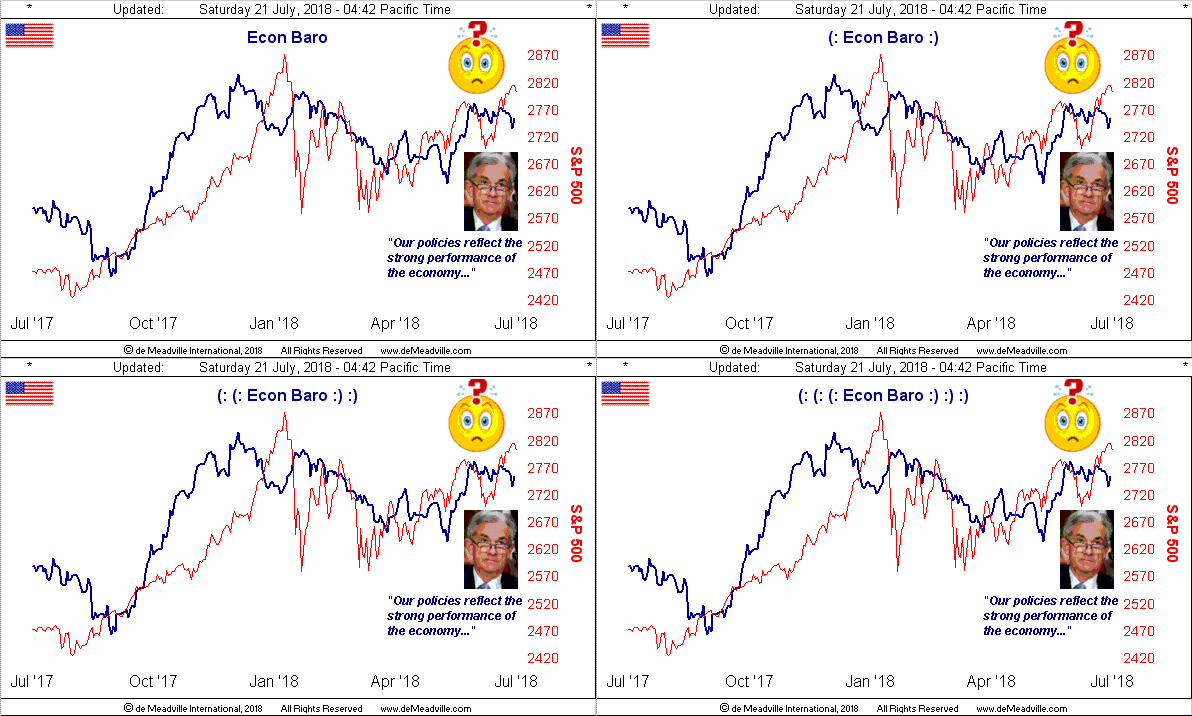
However, hardly gone is the optimism from the folks at the Federal Reserve Bank, Chairman Bill Powell putting forth to Congress this past that that all is well to maintain rate hikes for a spell. And yet since 12 June, our Economic Barometer has gone through better than a full cycle of monthly incoming EconData without being able to swing higher. We're dubious to the extent this was put forth to both the House Financial Services Committee and the Senate Banking Committee, but as you know, a picture's worth a thousand words, in this, the Econ Baro:
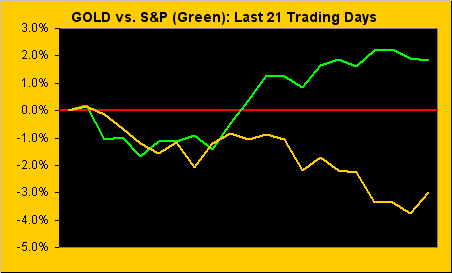
Indeed, the stock market as measured by the S&P 500 has its own ideas on seeking a new high whilst still remaining heavily over-valued and correction-less. As penned in Friday's Prescient Commentary: "...Q2 Earnings Season is picking up steam, most companies reporting higher levels than in the like period a year ago, but the reality is: the p/e of the S&P remains unrealistically high..." We maintain that the S&P shall duly see 2154 in correcting 25% from it's 2872 all-time high; as to the burr 'twould place in Gold's butt, the yellow metal's overhead resistance still must be overcome. And increasing so as we saw a week ago, Gold and the S&P clearly are furthering their separate ways. Here are their respective percent tracks from one month ago-to-date, (21 trading days):
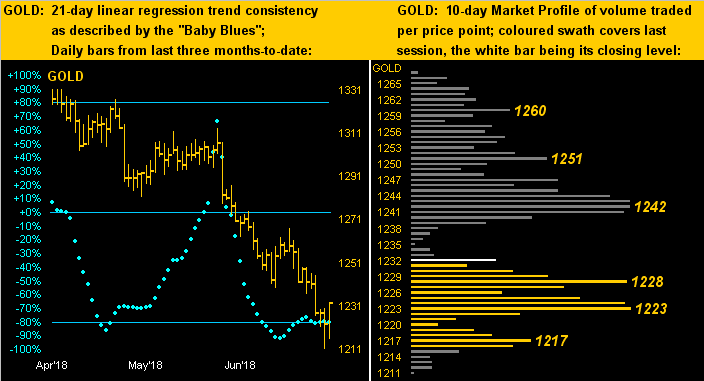
Now to Gold's two-panel view of the daily bars from three months ago-to-date on the left and the 10-day Market Profile on the right. With the baby blue dots of linear regression consistency hovering 'round the -80% axis and Friday's price bounce, a tradable rally may be in the offing, albeit the Profile's resistor at 1242 appears a bit formidable:
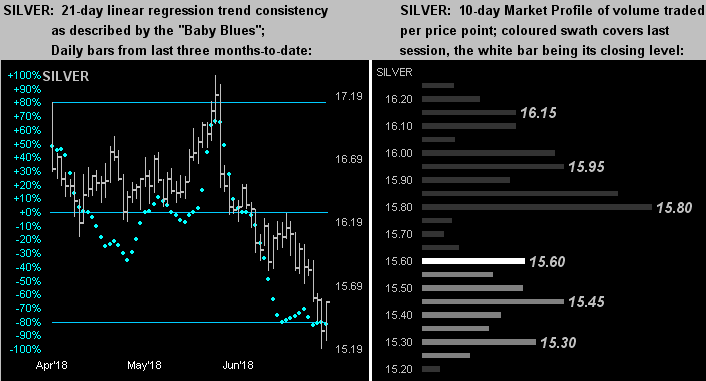
The picture for Silver is almost identical, her "Baby Blues" (left) trying to firm at the lower axis, but with 15.80 in her Profile (right) the most dominant resistor:
Yes 'tis "dollar strength"; yes 'tis higher rates; yes 'tis America lookin' great. But we all know that at some point the "3Ds" shall aggravate -- such that to Gold one and all shall capitulate: Debasement, Debt and Derivatives shan't eternally inflate! And there's the the "Copper Shocker"! More on that in next week's piece. In the interim, from here in the high country, hang onto your Gold!