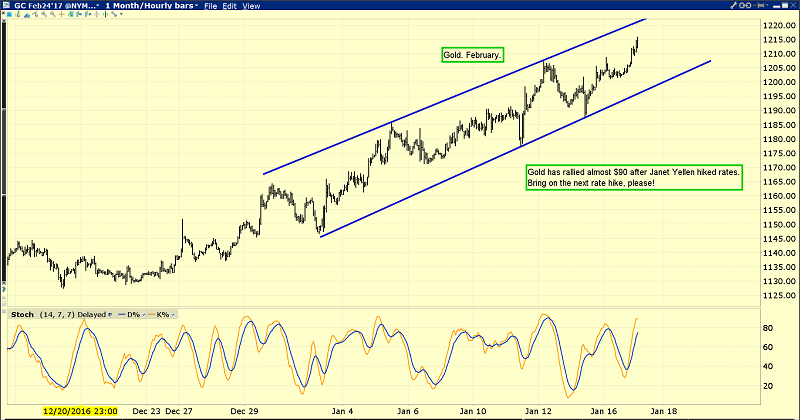
Rate hikes tend to be good for gold, and even better for gold stocks. On that note, this is the hourly bars gold chart.
Since Janet Yellen hiked rates in December, gold has rallied almost $90. That’s good news, but the great news is that the US central bank plans more rate hikes this year.
Gold has a rough historical tendency to decline ahead of rate hikes, and rally strongly after they happen.
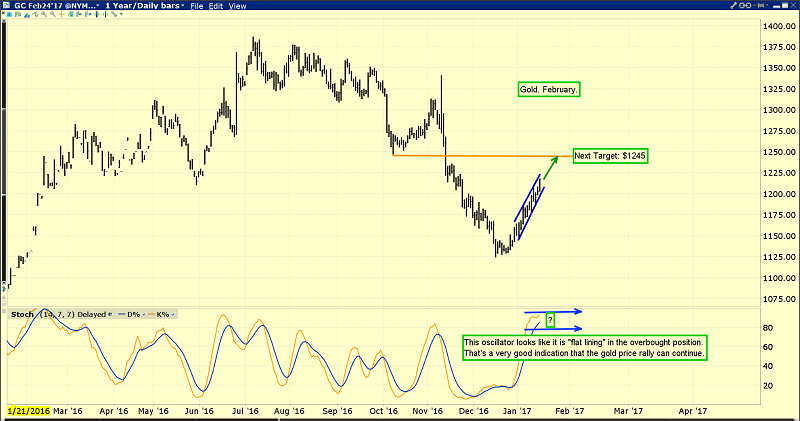
This is the daily bars gold chart.
The 14,7,7 Stochastics oscillator is beginning to show signs of “flat lining” in the overbought position. That tends to happen during very strong rallies.
Britain’s prime minister Theresa May is about to make a key speech on the Brexit. That could push gold into my next profit booking target zone at $1245.
Both gold and gold stocks have been chewing through overhead resistance zones with ease this year, and $1245 is the next one. Gold price enthusiasts should be light sellers if gold goes near that $1245 target zone.
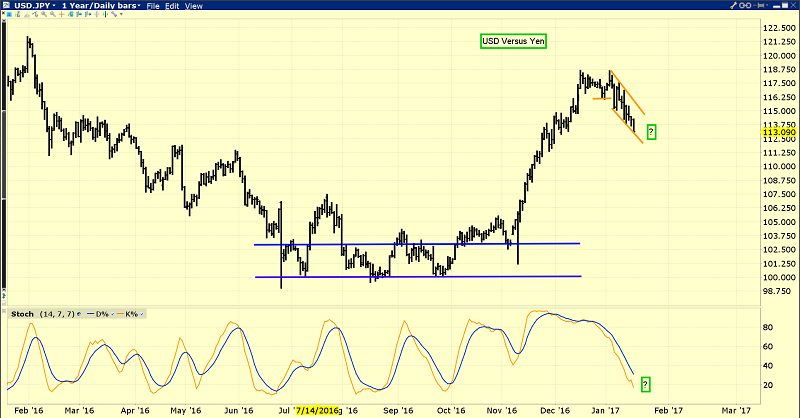
The dollar continues to weaken against the safe-haven yen, with smart money bank traders long the yen, and short the dollar.
Gold’s rally began when the dollar began falling against the yen in December.
Donald Trump is good for gold in a number of ways.
Uncertainty is one of them, but he’s also poised to ramp up infrastructure spending (inflationary).
Also, for the past 50 years, gold sports a good track record of rising during US presidential transition years. 2017 is a transition year.
Trump endorses a lower dollar and higher interest rates. If he’s able to do that, inflationary pressures would increase quite dramatically.
Higher rates incentivize banks to make loans, and a lower dollar itself pushes gold higher.
As good as gold looks now, gold stocks look even better. Influential analysts at Credit Suisse bank are very positive about gold stocks, regardless of whether gold rises or falls, but they see gold at $1300+ in 2017.
Mining companies that have cut costs are well-prepared to handle lower gold prices, and they will have great profits at even slightly higher prices.
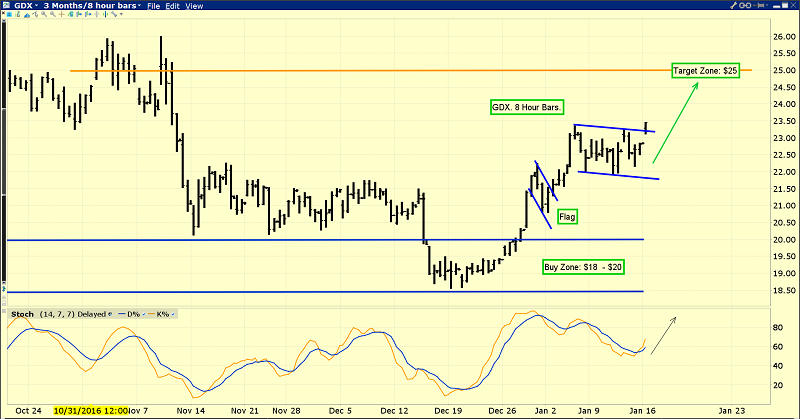
This is the fabulous GDX (NYSE:GDX) chart.
GDX is breaking out of a drifting rectangle, and beginning to surge towards the $25 target zone. Gamblers can buy the breakout with a tight stop-loss order, targeting that $25 area.
Longer term investors who bought in the $20 - $18.50 area can lighten up a bit in the $25 area too, if GDX makes it there.
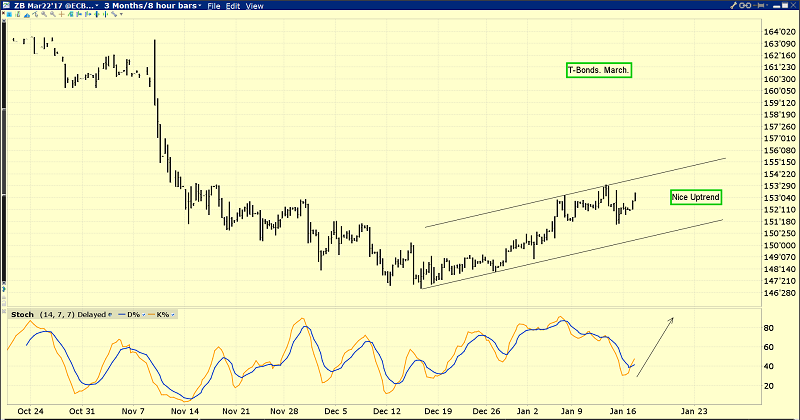
T-bonds are rallying nicely along with gold, and Ben Bernanke just added some “punch” to the price action, with his latest statement that the decline in the T-bond was likely a bit overdone.
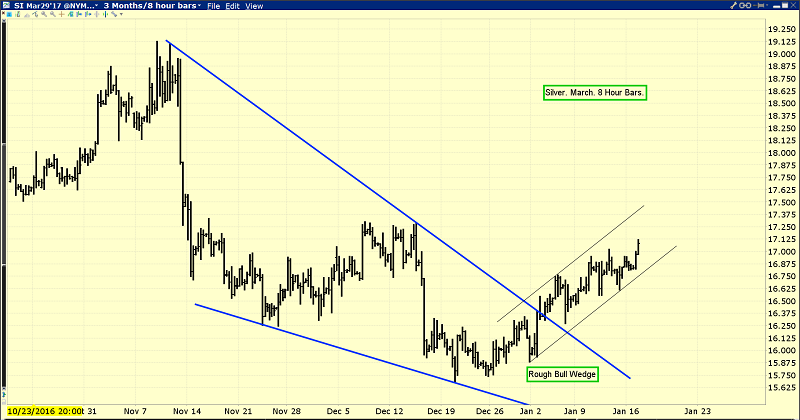
This is the silver chart.
Silver is moving higher in a “steady as she goes” manner. This type of price action is indicative of a rally that may be in the early stages, rather than near an end.
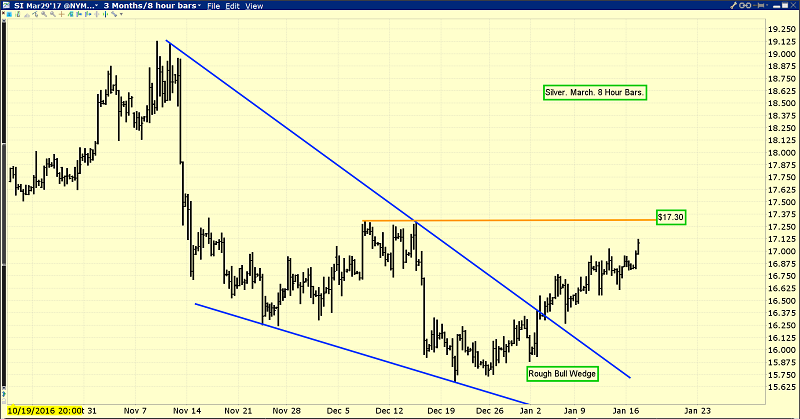
Another look at the silver chart. The $17.30 area is quite important. I think the Trump inauguration should be the catalyst that moves silver above $17.30, and ushers in the kind of “meat and potatoes” rally that most of the world’s silver bugs are waiting for!
Risks, Disclaimers, Legal
Stewart Thomson is no longer an investment advisor. The information provided by Stewart and Graceland Updates is for general information purposes only. Before taking any action on any investment, it is imperative that you consult with multiple properly licensed, experienced and qualified investment advisors and get numerous opinions before taking any action. Your minimum risk on any investment in the world is: 100% loss of all your money. You may be taking or preparing to take leveraged positions in investments and not know it, exposing yourself to unlimited risks. This is highly concerning if you are an investor in any derivatives products. There is an approx $700 trillion OTC Derivatives Iceberg with a tiny portion written off officially. The bottom line:
Are You Prepared?
