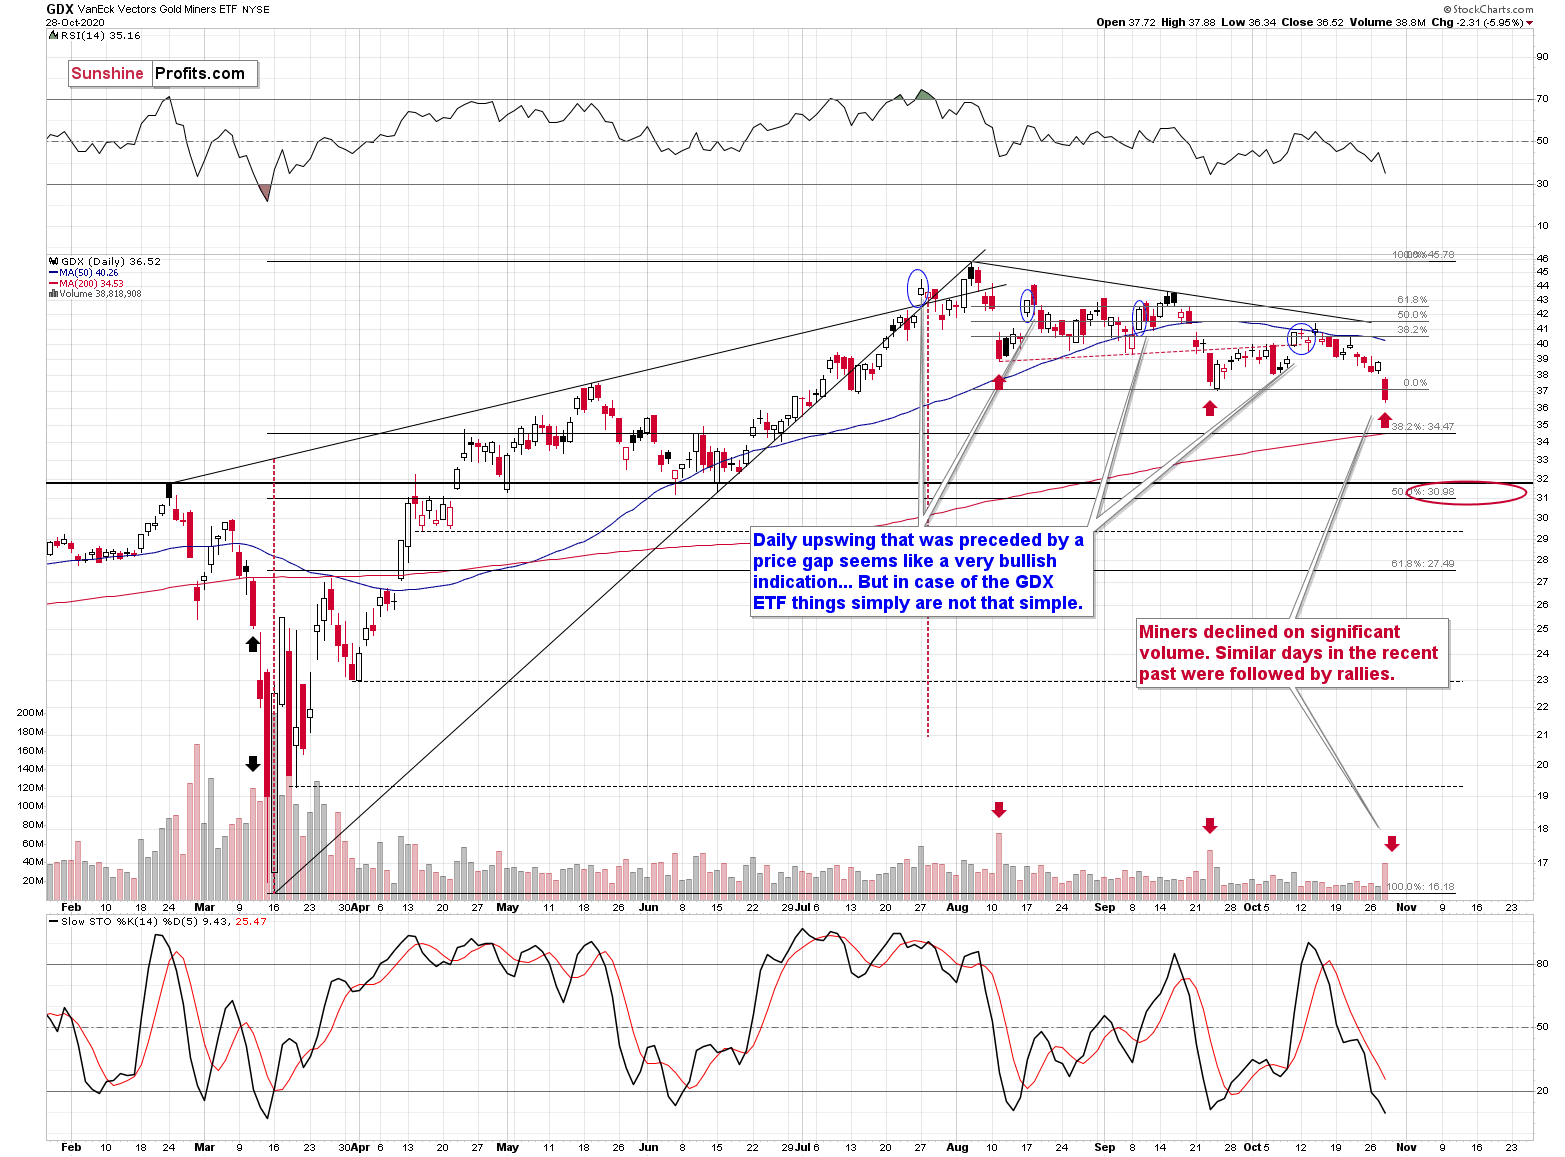
I previously wrote that practically nothing happened on the gold market, which is bearish since gold should be rallying or trading at higher levels, given the pre-election uncertainty. However, gold didn't wait for the elections to begin its decline. It plunged yesterday, taking silver and mining stocks along with it. To be more precise, it was the mining stock sector that brought down the rest. Miners moved and closed the day below their previous September and October lows and, therefore, anyone who joined us recently is not gaining profits. But, is every factor truly bearish for the miners? It is not the case.

Miners have been undermining gold, which is bearish, and they have also broken below the recent lows, which is also bearish. Moreover, miners have just declined on strong volume after opening the day with a price gap, which at first sight, is bearish.
The theory is that such sessions are particularly bearish, as they supposedly show the bears' strength. But, before applying any trading tip into practice, it’s important to check if it had indeed worked on a given market, especially in the recent past. And the aforementioned did work – in the opposite way.
For the third time, miners are declining substantially during one day on a strong volume. We saw the same thing happening in mid-August and late September. None of them were followed by lower miner prices. Instead, we’ve witnessed corrective upswings that didn’t change the overall downtrend.
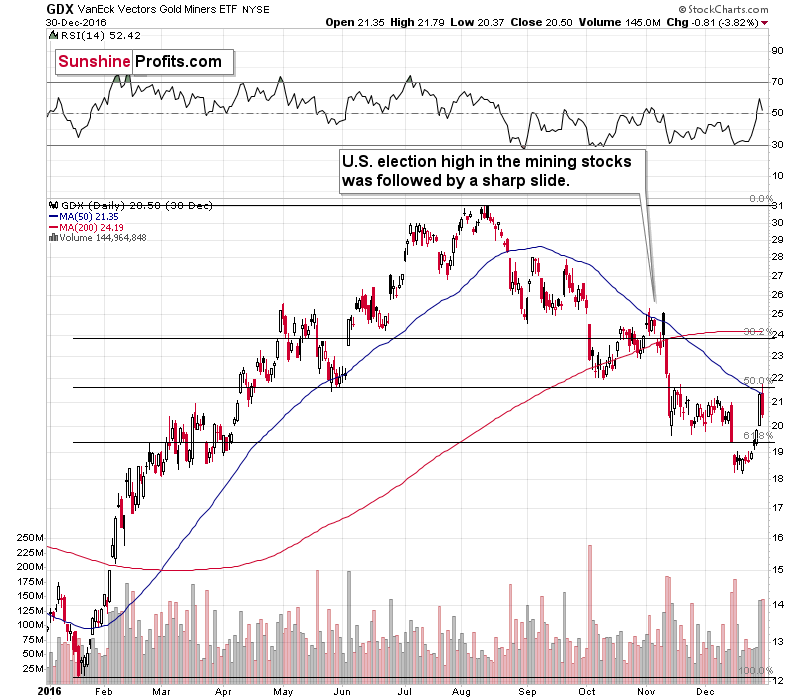
So, from here on in, will miners rally or decline? Overall, the very near term (until the election in the U.S. and a day or two after that) is unclear. At this point, a temporary rebound here would not surprise me at all. And if we see one, I expect it to be followed by a major slide. That’s precisely what happened right before and after the election in 2016.

The precious metals sector (miners included) moved higher right before the elections only to slide profoundly in the following days.
The post-election decline started from above the 38.2% Fibonacci retracement based on the preceding big upswing and the 50-day moving average. It ended once miners declined below the 61.8% Fibonacci retracement.
Could that happen again? It seems quite possible. History might repeat itself to a considerable degree. The GDX is above its 38.2% Fibonacci retracement, and if it moves a bit higher, it will be relatively close to its 50-day moving average.
Moving below the 61.8% Fibonacci retracement – just like in 2016 – it would imply a move below $27.5, which could very well happen if gold declines significantly from here. And it is quite likely to do so, as I emphasized in my previous analyses .
