
With the S&P 500 back at its all-time highs, gold stopped lagging behind. However, how long can this unsustainable growth last?
The FOMO Rally
While the S&P 500 has demonstrated a resounding ability to shake off bad news, an epic divergence has developed between positioning and economic expectations. And while ‘fear of missing out’ (FOMO) keeps sentiment near the high-end of its range, Q3 GDP growth is projected near the low-end of its range.
For example, while the Atlanta Fed’s third-quarter GDP growth estimate was north of 5% in early September, the bank reduced the estimate to 1.3% on Oct. 5. Moreover, with the outlook even worse now, the Atlanta Fed cut its Q3 GDP growth estimate to 0.5% on Oct. 19.
Please see below:
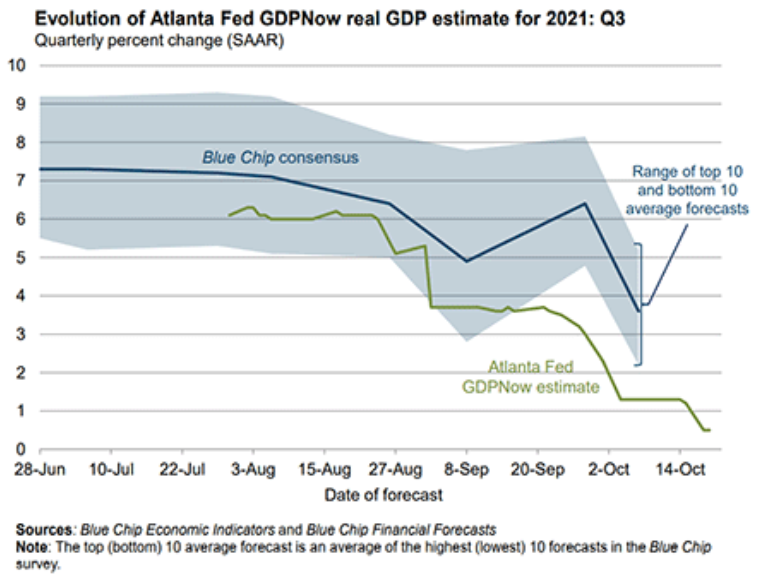
To explain, the blue line above tracks the blue chip consensus GDP growth estimate for the third quarter, and the shaded blue area represents the range of economists’ estimates. If you analyze the depth, you can see that economists expect a print in the ~2% to ~5.5% range. In stark contrast, the green line above tracks the Atlanta Fed’s GDPNow estimate – which has sunk like a stone and now implies 0.5% GDP growth in the third quarter.
What’s more, Bank of America also released its latest Global Fund Manager Survey on Oct. 19. And with institutional investors increasing their equity exposure when their economic expectations have turned negative for the first time in 18 months, FOMO is now on full display.
Please see below:
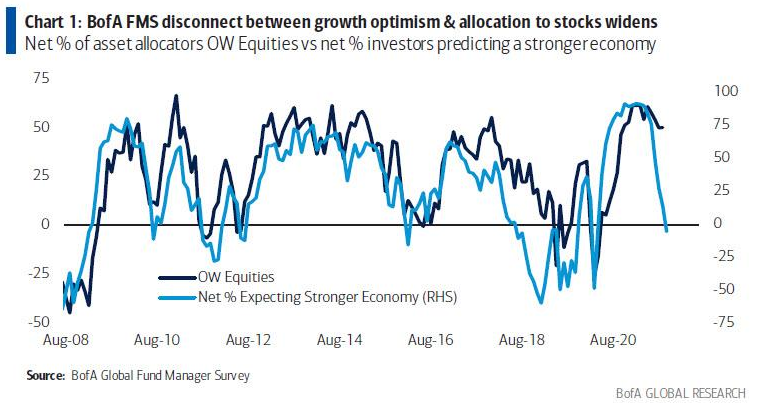
To explain, the dark blue line above tracks the net percentage of respondents that are overweight equities, while the light blue line above tracks the net percentage of respondents that expect stronger economic growth. If you analyze the right side of the chart, you can see that intuitional investors’ equity positioning still far exceeds what’s implied from economic growth prospects. As a result, if the dark blue line moves lower and reconnects with the light blue line, plenty of sell orders will hit the market.
On top of that, with stagflation fears now front and center, institutional investors are hitting the bid even when their better judgment tells them otherwise.
Please see below:
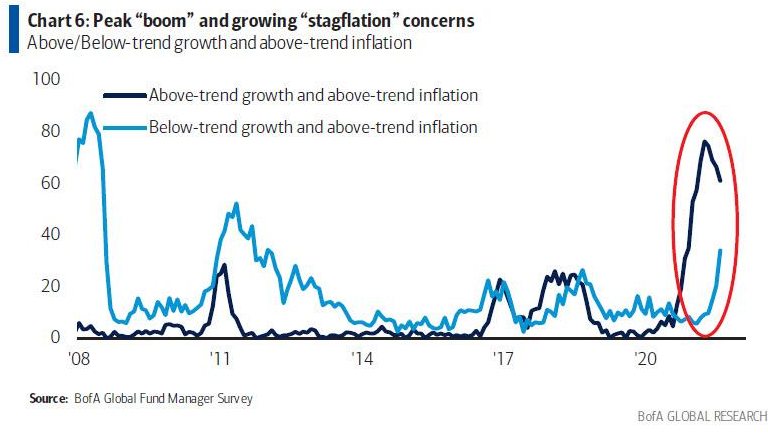
To explain, the dark blue line above tracks the net percentage of respondents that expect above-trend growth and above-trend inflation, while the light blue line above tracks the net percentage of respondents that expect below-trend growth and above-trend inflation. If you analyze the red circle on the right side of the chart, you can see that growth-with-inflation prophecies are losing momentum (the dark blue line), while fears of low growth and persistent inflation are increasing (the light blue line).
Will We See an Inflation Miracle?
Moreover, with the Fed stuck between a rock (high inflation) and a hard place (weak growth), the margin for error has dwindled and one policy mistake could bring down equities’ entire house of cards.
To that point, while I’ve been warning for months that the Fed was (and still is) materially behind the inflation curve, FOMC officials aren’t the only ones displaying inflationary anxiety.
Please see below:
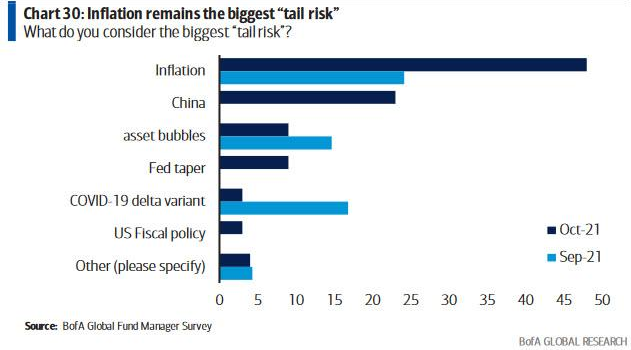
To explain, inflationary concerns have surged in October. And while the spread between institutional investors’ concerns over “Inflation” and the “Fed taper” is quite the oxymoron, persistent inflation makes another hawkish surprise even more likely. Moreover, with the death of QE unlikely to solve the inflationary conundrum on its own, the Fed will likely forecast further tightening in 2022.
To that point, slowly but surely, institutional investors are waking up to this reality. For context, Q3 earnings calls have been riddled with mentions of inflation and many CEOs that dabble in real goods have projected a further acceleration in 2022. As a result, with the “transitory” camp now suffering a death by a thousand cuts, it will likely take a miracle for the Fed’s 2022 inflation forecast to come to fruition.
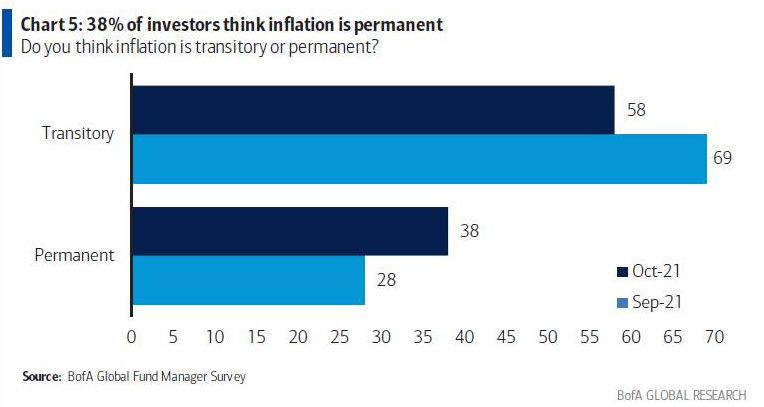
To explain, 69% (28%) of respondents viewed inflation as “transitory” (“permanent”) in September. However, the script has flipped to 58% and 38% in October. As a result, it’s likely only a matter of time before the majority of institutional investors (and the Fed) realize what’s actually happening on the ground.
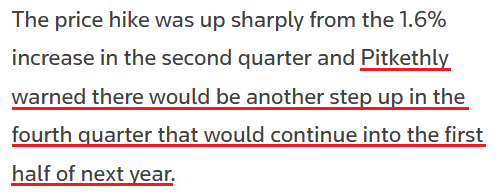
Case in point: Unilever (NYSE:UL) – a consumer goods company with 149,000 employees and 400 brands that operates in more than 190 countries – released its third-quarter earnings on Oct. 21. CFO Graeme Pitkethly said that Q4 price increases should at least rival Q3 and extend into 2022:
Source: Reuters
Moreover, Unilever CEO Alan Jope told Bloomberg on Oct. 21:
“Peak inflation will be in the first half of 2022, and it will moderate as we move towards the second half…. We continue to responsibly take pricing, and that’s in relation to the very high levels of inflation we’re seeing.”
The S&P 500 Ahead Of A Deep Correction?
Furthermore, I highlighted on Oct. 21 that rising commodity prices over the last month should filter into the Commodity Producer Price Index (PPI) and headline Consumer Price Index (CPI) in the coming months.
I wrote:
The commodity PPI is a reliable leading indicator of the following month’s headline Consumer CPI. And if the former stays flat for the next three months (which is unlikely) – referencing releases in November 2021, December 2021 and January 2022 – the readings will still imply year-over-year (YoY) percentage increases in the headline CPI in the 4.75% to 5.50% range.
Furthermore, this is an extremely conservative forecast since the commodity PPI has increased month-over-month (MoM) for the last 17 months. Thus, it’s more likely that the headline CPI rises above 6% YoY than it falls below 4% YoY.
To that point, Union Pacific Railroad (NYSE:UNP) – a shipping company that operates 8,300 locomotives in 23 U.S. states – released its third-quarter earnings on Oct. 21. And with freight revenue up by 12% and average revenue per car up by 9%, EVP Kenny Rocker said that the results reflected “strong core pricing gains and higher fuel surcharge revenue.”
More importantly, though, with the input surge intensifying “over the last 30 days,” the cost-push inflationary spiral remains alive and well, and it signals something important.
Source: Union Pacific Railroad/ The Motley Fool
Finally, the reason why inflation is so important in terms of its direct effect on the general stock market and its indirect effect on the precious metals is due to the composition of the S&P 500. With information technology and communication services stocks accounting for roughly 39% of the S&P 500’s movement, deflationary assets have been the go-to source for returns since 2009. However, if the “transitory” narrative suffers a painful death, a material unwind could ensure.
Please see below:
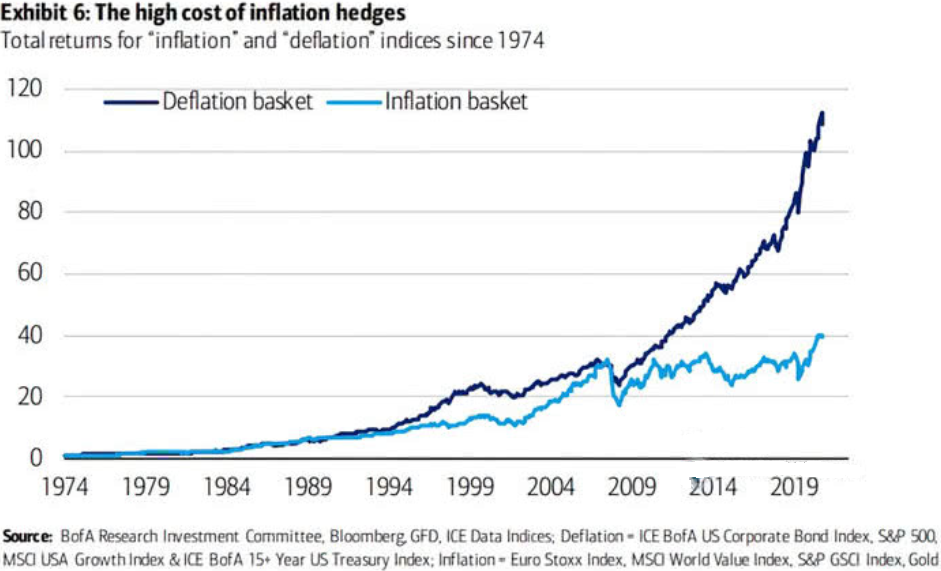
To explain, the “deflation basket” (the dark blue line) has materially outperformed the “inflation basket” (the light blue line) since the global financial crisis (GFC). Thus, if surging inflation encourages a reversion to the mean, immense volatility could strike the S&P 500.
The bottom line?
With investors prioritizing FOMO over fundamentals, the general stock market’s recent uprising has helped uplift the precious metals. However, with the Fed losing its inflation battle and the USD Index poised to benefit from more hawkish momentum over the next few months, a profound correction of the S&P 500 will only enhance the U.S. dollar’s already robust fundamentals. Moreover, with the precious metals often moving inversely to the U.S. dollar, their performance should suffer along the way.
In conclusion, the precious metals declined on Oct. 21, as the USD Index regained its mojo. Furthermore, the front-end of the U.S. yield curve surged (2-year yield up by 21% rounded), and the U.S. 10-Year Treasury yield closed at its highest level (1.7% rounded) since April 4. Thus, while the precious metals borrow confidence from the S&P 500, their fundamentals are actually deteriorating rather quickly.