
Returning to San Francisco is always tough enough, but try this for a bring-down: well into our 10th year of faithfully penning The Gold Update without a single Saturday miss, en route (for those of you scoring at home) toward edition No. 500, yours truly walked into last Sunday's Investors Roundtable and the first thing out of a valued member's mouth was "The price of Gold may never go up again."
Moreover, correlative evidence was provided as proof. ('Tis an analysis we'd need to personally number-crunch before rendering a like opinion -- heaven forbid -- and it esoterically is relative to the movement of Japanese interest rates, or lack thereof. On verra). Rather, our preference is to remain fastidiously steadfast for far higher Gold prices as the 3Ds of Debasement, Debt and Derivatives continue to disseminate.
But specific to this week's title for Gold being box-bound, price now obviously having gone down to be so bound, we're appropriately put in mind of the rockin' Allman Brothers blues tune from '73 "Southbound... Lord I'm comin' home to you..."... home, in this case, being The Box (1280-1240). During this past abbreviated trading week, gold dropped to a fresh low (1273) for the year. Price settled week's end (Thursday) at 1278. 'Tis Gold's first weekly closure back inside The Box (1280-1240) since 21 December. So much for Neverland (aka "The Whiny 1290s") lending support, eh? Albeit price did therein dance around and about for these past eight weeks.
Still, after a very slow start of the same duration with the current parabolic Short trend of little price decline whatsoever, this past week was more of a downside kick in the teeth. Recall herein written two missives ago: "As for the 'Baby Blues' [in reference to Gold's linear regression trend analysis] ... their decline ... is cause for further downside concern..." Well, you know our old quip: avoid the news, trade the Blues, else lose yer shoes. And in turning to Gold's weekly bars, the southbound route has now become a bit more obvious:

"But, mmb, does your 'Box' hold this time?"
Given our foreboding sense, Squire, of economic softness, the (as we put it a week ago) "wildly overbought" S&P 500 accompanied by its inflated price/earnings ratio and deflating moneyflow, and general political chaos having become the StateSide norm, in a word: "Yes".
As for the Economic Barometer itself, the last two weeks have been its best fortnight since that ending 07 September. This most recent week featured a bountiful bounce for April's New York State Empire Index and an up-tick in the National Association of Home Builders Index, along with a very positive turnaround for March's Retail Sales, plus a reduction in the Trade Deficit as measured for February along with a working down of Inventories at both the Wholesale and Business levels. However, there were a couple of stinkers, notably a drop in the April Philadelphia Fed Index and a decline in March Industrial Production. But on balance, the Baro has been "saved" of late:

But even as regards the "insane" height of the S&P (the red line in the above graphic), the once respected Barron's published this past week that "The S&P 500 Is Off to a Great 2019 Start. History Says It Can Keep Going", the omission there being that history shows the S&P crashes from P/E ratios as high as is our current "live" reading of 31.3x, and further that the Index ultimately turns toward the Econ Baro. Uh-oh. 'Course the same publication then went on to tell us that for Monday the "Dow Dips 28 Points Because the Market Is Still Waiting for Something" and that for Wednesday "The Dow Loses 3 Points Because We’re Near Record Territory". People are actually being paid to come up with this brilliance. Uh-oh indeed.
'Course Gold is dealing with its own "uh-oh" as is evident in moving on to our two-panel graphic of price's daily bars from three months ago-to-date on the left and the 10-day Market Profile on the right. And as noted earlier, the baby blue dots of linear regression trend consistency are extending their descent whilst in the Profile the 1296/1295 area has been replaced by 1278 as the most heavily-traded price these past two weeks:

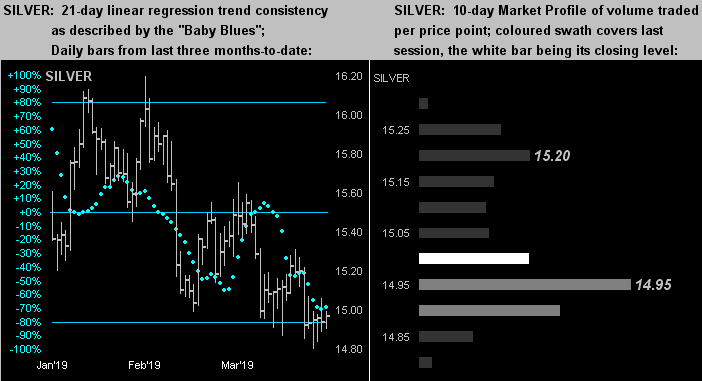
Silver's picture -- whilst essentially akin to that for Gold -- does have (dare we say) a wee Silver lining or two. Her price just in this past week per the rightmost bars (at left) looks far firmer that does that for Gold, whilst in her Profile (at right) she's just above her 14.95 line in the sand. Are folks finally realizing the excessive stance of the Gold/Silver ratio being at 85.4x? Doubtful, but 'tis:
So with a new low year-to-date for Gold, here's how it all stacks up, (or perhaps "down" if you choose):
The Gold Stack
Gold's Value per Dollar Debasement, (from our opening "Scoreboard"): 2857
Gold’s All-Time High: 1923 (06 September 2011)
The Gateway to 2000: 1900+
Gold’s All-Time Closing High: 1900 (22 August 2011)
The Final Frontier: 1800-1900
The Northern Front: 1750-1800
On Maneuvers: 1579-1750
The Floor: 1466-1579
Le Sous-sol: Sub-1466
Base Camp: 1377
The 1360s Double-Top: (1362 in Sep '17 and 1369 in Apr '18)
2019's High: 1349 (20 February)
The Weekly Parabolic Price to flip Long: 1331
10-Session “volume-weighted” average price magnet: 1293
Trading Resistance: 1290 / 1296 / 1302 / 1308
Neverland: The Whiny 1290s
The Box: 1280-1240
Gold Currently: 1278, (expected daily trading range ["EDTR"]: 11 points)
Trading Support: right here at 1278
The 300-Day Moving Average: 1274 and falling
10-Session directional range: down to 1273 (from 1315) = -42 points or -3.2%
2019's Low: 1273 (18 April)
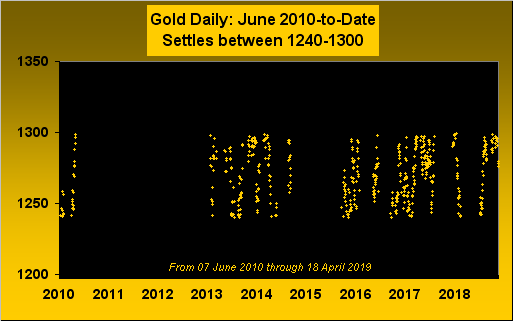
In closing, à propos of the above Stack and our eternally going on about The Box (1280-1240) and The Whiny 1290s, this final chart puts them both into nauseating perspective. Every Gold dot on the graph is a day wherein Gold settled somewhere in that exasperating range beginning with the first time ever on 07 June 2010 through this past week's final trading day of 18 April 2019. Again, there's your "Nine Years of Nuthin'!", (notwithstanding one's trading capacity to have hopefully benefited by the extremes along the way):
Still, at the end of the day, remember: Complacency Kills ... and when the seams finally burst, you'll love having Gold!