Concerning price action with oil falling on very bullish inventories as Trump and the FOMC indirectly boost gold.
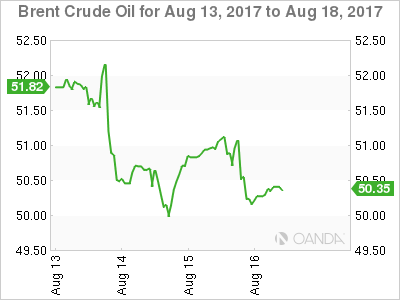
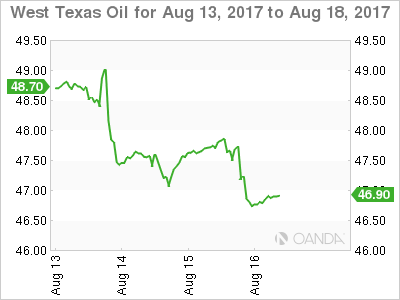
The official U.S. Crude Inventories delivered last night, announcing a monster drawdown, but crude prices themselves did not. After a brief rally following the numbers, both Brent and WTI collapsed to finish 2% lower for the session at 50.20 and 46.75 in what can only be viewed as a worrying technical development.
Amongst the scramble by analysts to fit facts to the somewhat confusing price action, I can only conclude that there was still a lot of speculative long positioning in the market, that threw in the towel once Brent crude broke its 100-day moving average. The rapidly closing long term contango structure in the oil futures market is at odds with the movements lower in spot crude and most certainly cannot be explained by talk of OPEC noncompliance and peak oil demand, both of which are longer term indicators.
Brent spot is trading at 50.25 and has now broken and closed below its 100-day moving average at 50.50, joining WTI spot in the naughty corner after managing to maintain its good behaviour bond over Tuesday’s API Inventories. The next resistance sits at 51.10 with initial support at 49.70. A move through the latter is possibly signalling a deeper move lower to the 47.50 area.

WTI spot trades near its New York sitting at 46.80 with nearby support at 46.20 with a break suggesting more pain to the 45.20 area. After three consecutive daily closes below its 100-day moving average, this morning at 47.80, and its overnight high at 48.00, this level must break if WTI is to be deemed worthy of a good behaviour star.

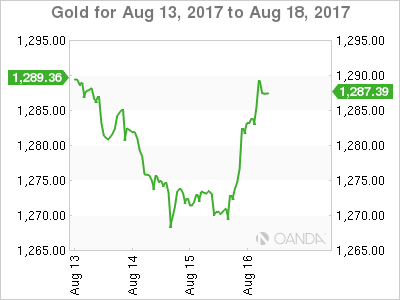
A combination of pseudo dovish FOMC minutes and President Trump dismantling his councils of wise CEO’s brought an abrupt end to the U.S. dollar rally of the past few days which in turn saw gold a beneficiary. As the chaos of daily life on the Hill in Washington D.C. and a nervous Fed sunk the dollar, gold rose from a low of 1267.70 to charge 15 dollars higher and close at 1282.70.
With gold making back all its losses from the previous day, it has opened bullishly in Asia, trading four dollars higher at 1286.50 in early trade. To act as the voice of reason, however, I must note that gold’s price action of the past three days has been entirely driven by the overall direction of the U.S. dollar in isolation. Therefore it is important to understand that golds ebbs and flows are not due to any factors in particular with gold’s appeal or not; rather traders are taking a view on the big dollar.
That said, from a technical perspective, the price action was impressive, and gold is now in shouting distance of both last week’s high at 1292.50 and the monster 1296.00 regions, a break of which could be suggestive of a structural, medium term move higher to a 1300 handle.
On the downside, initial support lies now at 1282.00 followed by the more import 1275.00 and 1267.00 levels. In the shorter term, and in the absence of any geopolitical headlines, traders should watch the performance of the dollar against its G-10 peers for clues to gold’s short term direction.

